您好,登錄后才能下訂單哦!
您好,登錄后才能下訂單哦!
本篇內容介紹了“如何使用vue實現柱形圖”的有關知識,在實際案例的操作過程中,不少人都會遇到這樣的困境,接下來就讓小編帶領大家學習一下如何處理這些情況吧!希望大家仔細閱讀,能夠學有所成!
使用vue實現柱形圖的方法:1、創建div屬性為“<div ref="BarChart" style="height: 1000px; width: 100%"/>”;2、通過“mounted(){this.fetchData()window.addEventListener('resize',()=>{if (this.chart){...}”實現立體柱狀圖即可。
vue 實現立體柱狀圖
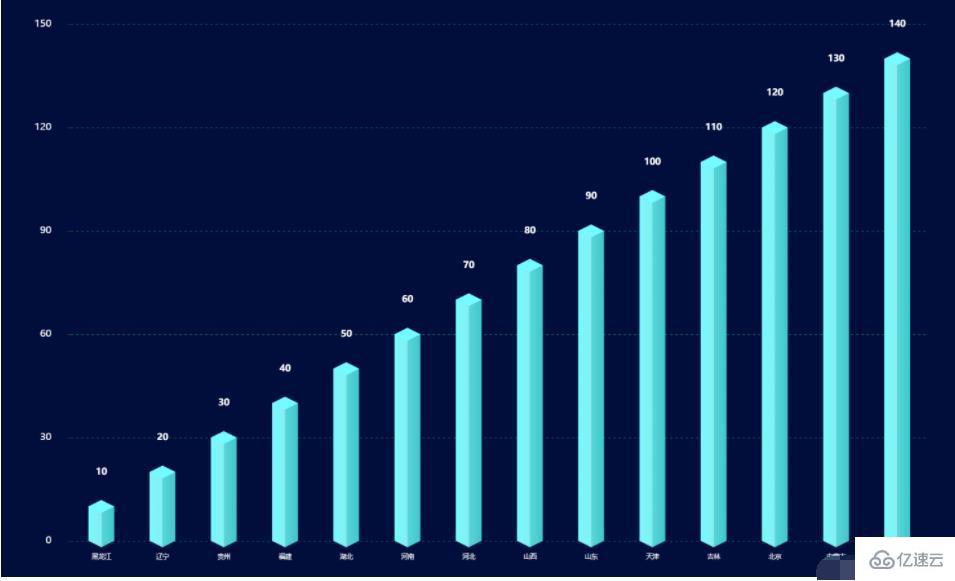
樣式如下圖所示:
可以將立體柱狀圖看做由yData+底+頂構成,對應代碼如下:
<template>
  <div ref="BarChart" style="height: 1000px; width: 100%"/></template>
<script>import echarts from 'echarts'export default {
  data() {
    return {
      chart: null,
      data: [], //數據
      xData: [], //x軸
      yBarData: [], //y軸
      yLable: [],
      colorStops: [],
      chartLegend: [], //圖例
      colorOptions: [ //圖例以及柱形圖顏色選擇
        '#5ba2e4',
        '#f58510',
        '#afa5a5',
        '#facb3d',
        '#0854cf',
        '#48c611',
        '#082b63'
      ]
    }
  },
  mounted() {
    this.fetchData()
    //圖的大小自適應
    window.addEventListener('resize',()=>{
      if (this.chart){
        this.chart.resize()
      }
    })
  },
  beforeDestroy() { //實例銷毀之前調用
    if (!this.chart) {
      return
    }
    this.chart.dispose()
    this.chart = null
  },
  methods: {
    fetchData() {
      this.xData = ["黑龍江",'遼寧','貴州','福建','湖北','河南','河北','山西','山東','天津','吉林','北京','內蒙古','云南']
      this.yLable = ['10','20','30','40','50','60','70','80','90','100','110','120','130','140']
      this.chartLegend = []
      const dateArr = []
      this.yLable.forEach((item, index) => {
        if (item !== null && item !== undefined) {
          dateArr.push(this.yLable[index])
        }
      })
      this.chartLegend = dateArr      this.initData()
      this.initChart()
    },
    initData() {
      this.yBarData = this.yLable    },
    initChart() {
      this.chart = echarts.init(this.$refs.BarChart)
      this.chart.clear() // 清空當前實例
      let colors = []
      const dom = 800
      const barWidth = dom / 20
      for (let i = 0; i < 4; i++) {
        colors.push({
          colorStops: [
            {
              offset: 0,
              color: '#73fcff' // 最左邊
            }, {
              offset: 0.5,
              color: '#86eef1' // 左邊的右邊 顏色
            }, {
              offset: 0.5,
              color: '#5ad6d9' // 右邊的左邊 顏色
            }, {
              offset: 1,
              color: '#3dc8ca'
            }]
        })
      }
      this.chart.setOption({
        backgroundColor: '#010d3a',
        //提示框
        tooltip: {
          trigger: 'axis',
          formatter: "{b} : {c}",
          axisPointer: { // 坐標軸指示器,坐標軸觸發有效
            type: 'shadow' // 默認為直線,可選為:'line' | 'shadow'
          }
        },
        /**區域位置*/
        grid: {
          left: '10%',
          right: '10%',
          top: '10%',
          bottom: '10%',
        },
        //X軸
        xAxis: [{
          data: this.xData,
          type: 'category',
          show: true,
          axisLine: {
            show: false,
            lineStyle: {
              color: 'rgba(255,255,255,1)',
              shadowColor: 'rgba(255,255,255,1)',
              // shadowOffsetX: '20'
            },
            symbol: ['none', 'arrow'],
            symbolOffset: [0, 25]
          },
          splitLine: {
            show: false
          },
          axisTick: {
            show: false
          },
          axisLabel: {
            margin: 20,
            fontSize: 10
          }
        }],
        yAxis: {
          show: true,
          splitNumber: 4,
          axisLine: {
            show: false
          },
          splitLine: {
            show: true,
            lineStyle: {
              type: 'dashed',
              color: '#075858'
            },
          },
          axisLabel: {
            show: true,
            color: '#FFFFFF',
            margin: 30,
            fontSize: 15
          }
        },
        series: [
          {//數據顏色
            name: '日付費用戶數',
            type: 'bar',
            barWidth: barWidth,
            itemStyle: {
              normal: {
                color: (params) => {
                  return colors[params.dataIndex % 4];
                }
              }
            },
            label: {
              show: true,
              position: [barWidth / 2, -(barWidth + 20)],
              color: '#ffffff',
              fontSize: 14,
              fontStyle: 'bold',
              align: 'center'
            },
            data: this.yBarData          },
          {//底
            z: 2,
            type: 'pictorialBar',
            data: this.yBarData,
            symbol: 'diamond',
            symbolOffset: [0, '50%'],
            symbolSize: [barWidth, barWidth * 0.5],
            itemStyle: {
              normal: {
                color: (params) => {
                  return colors[params.dataIndex % 4]
                }
              }
            }
          },
          {//頂
            z: 3,
            type: 'pictorialBar',
            symbolPosition: 'end',
            data: this.yBarData,
            symbol: 'diamond',
            symbolOffset: [0, '-50%'],
            symbolSize: [barWidth, barWidth * 0.5],
            itemStyle: {
              normal: {
                borderWidth: 0,
                 color: (params) => {
                  return colors[params.dataIndex % 4].colorStops[0].color;
                }
              }
            }
          }
        ]
      }, true)
    }
  }}</script>
上述js代碼中,有如下注意事項:
顏色選擇:可以將colors[params.dataIndex % 4]替換為this.colorOptions[params.dataIndex % 4],即使用代碼中定義的colorOptions進行顏色填充
colorStops保證了立體的效果
代碼中colors[params.dataIndex % 4]中的4的選取是可變的,保證索引值在colors變量的長度范圍內。例如:本例中colors長度為4,params.dataIndex % 4不超過4即可
引用上述barchart可應用如下代碼:
<template>
  <bar-chart /></template>
<script>import barChart from "./components/barChart"export default {
  name: 'barchart',
  components: {  barChart }}</script>
“如何使用vue實現柱形圖”的內容就介紹到這里了,感謝大家的閱讀。如果想了解更多行業相關的知識可以關注億速云網站,小編將為大家輸出更多高質量的實用文章!
免責聲明:本站發布的內容(圖片、視頻和文字)以原創、轉載和分享為主,文章觀點不代表本網站立場,如果涉及侵權請聯系站長郵箱:is@yisu.com進行舉報,并提供相關證據,一經查實,將立刻刪除涉嫌侵權內容。