您好,登錄后才能下訂單哦!
您好,登錄后才能下訂單哦!
本篇內容主要講解“Vue+OpenLayer怎么實現測距功能”,感興趣的朋友不妨來看看。本文介紹的方法操作簡單快捷,實用性強。下面就讓小編來帶大家學習“Vue+OpenLayer怎么實現測距功能”吧!
這個庫文件直接按照官網的來就可以了。 首先說一個事情哈,官網用的案例是地圖使用的 EPSG:3857, 如果我們改成 EPSG:4326,測量數據不準確,切記這一點。
  import 'ol/ol.css';
  import Draw from 'ol/interaction/Draw';
  import Map from 'ol/Map';
  import Overlay from 'ol/Overlay';
  import View from 'ol/View';
  import { Circle as CircleStyle, Fill, Stroke, Style } from 'ol/style';
  import { LineString, Polygon } from 'ol/geom';
  import { OSM, Vector as VectorSource } from 'ol/source';
  import { Tile as TileLayer, Vector as VectorLayer } from 'ol/layer';
  import { getArea, getLength } from 'ol/sphere';
  import { unByKey } from 'ol/Observable';
上面是我引入的庫文件,和官網基本上一樣。
首先我們看下圖官網效果,官網開始繪制或者是繪制中都在鼠標旁邊有一個title文本框用來提示用戶操作信息。
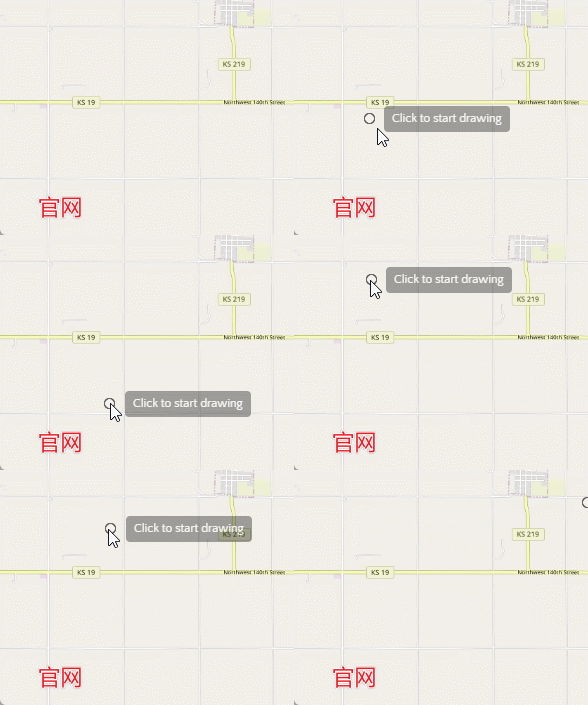
我們首先來實現一下這個功能。
首先說明一點哈,這是關鍵代碼,有些參數可能用起來發現沒有聲明,都是全局的,自己加在全局就可以,主要是下面這一些。
  var map = null
  var helpTooltipElement = null
  var feature = null;
  var helpTooltip = null;
  var draw = null;
  var measureTooltipElement = null;
  var measureTooltip = null;
  var listener = null;
  var mapMouseMove = null;
首先我們在需要實現測距功能的頁面上寫兩個按鈕,一個開始測距,一個結束測距。然后點擊開始測距的時候,執行一個方法,假設是distance方法。
  distance() {
        let source = new VectorSource()  // 首先創建一個數據源,用來放置繪制過程中和繪制結束后的線段
        const layer = new VectorLayer({  // 添加一個圖層,用來放置數據源,樣式自己隨便設置就可以了,我這里默認的官網
          source: source,
          style: new Style({
            fill: new Fill({
              color: 'rgba(255, 255, 255, 0.2)',
            }),
            stroke: new Stroke({
              color: '#ffcc33',
              width: 4,
            }),
            image: new CircleStyle({
              radius: 7,
              fill: new Fill({
                color: '#ffcc33',
              }),
            }),
          }),
        });
        mapMouseMove = map.on('pointermove', (ev) => {  // 給地圖添加一個鼠標移動事件
          let helpMsg = '點擊開始測量'    // 默認開始的操作提示文本
          if (feature) {  // featuer 是全局的,判斷有沒有點擊鼠標繪制過
            helpMsg = '雙擊結束測量'    // 如果之前點擊繪制了就顯示雙擊結束
          }
          helpTooltipElement.innerHTML = helpMsg;   // 設置dom的提示文字
          helpTooltip.setPosition(ev.coordinate);  // 設置位置跟著鼠標走
          helpTooltipElement.classList.remove('hidden')  // 讓他顯示出來
        })
        this.createHelpTooltip()   // 創建那個helpTooltipElement方法
        map.addLayer(layer)  // 把圖層添加到地圖
      },
然后調用了一個初始化操作提示的dom元素。這個就是官網的函數,如果參數名和自己起的或者是map的指向問題需要自己根據自己的實際修改一下。
      createHelpTooltip() {
        if (helpTooltipElement) {
          helpTooltipElement.parentNode.removeChild(helpTooltipElement);
        }
        helpTooltipElement = document.createElement('div');
        helpTooltipElement.className = 'ol-tooltip hidden';
        helpTooltip = new Overlay({
          element: helpTooltipElement,
          offset: [15, 0],
          positioning: 'center-left',
        });
        map.addOverlay(helpTooltip);
      },
還有一點,為了好看,把官網的樣式復制一下子。
<style scoped>
  /deep/.ol-tooltip {
    position: relative;
    background: rgba(0, 0, 0, 0.5);
    border-radius: 4px;
    color: white;
    padding: 4px 8px;
    opacity: 0.7;
    white-space: nowrap;
    font-size: 12px;
    cursor: default;
    user-select: none;
  }

  /deep/.ol-tooltip-measure {
    opacity: 1;
    font-weight: bold;
  }

  /deep/.ol-tooltip-static {
    background-color: #ffcc33;
    color: black;
    border: 1px solid white;
  }

  /deep/.ol-tooltip-measure:before,
  /deep/.ol-tooltip-static:before {
    border-top: 6px solid rgba(0, 0, 0, 0.5);
    border-right: 6px solid transparent;
    border-left: 6px solid transparent;
    content: "";
    position: absolute;
    bottom: -6px;
    margin-left: -7px;
    left: 50%;
  }

  /deep/.ol-tooltip-static:before {
    border-top-color: #ffcc33;
  }
</style>
然后就可以看到我們點擊“開始測距”按鈕之后,上面代碼執行,鼠標旁邊就出現一個小小的操作提示。
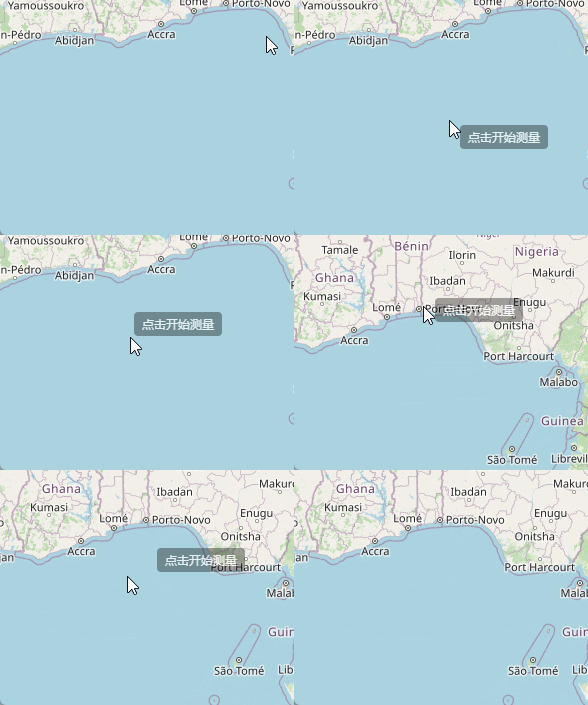
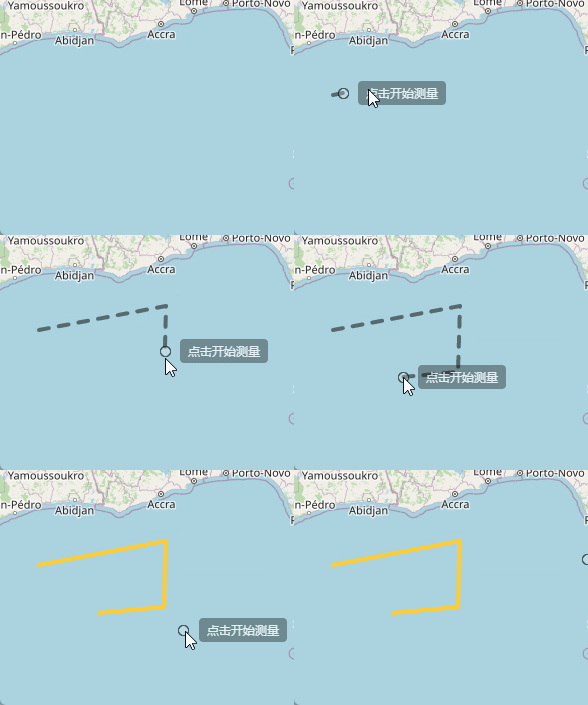
好的,通過上面的代碼呢,我們成功的繪制出了提示框,然后就是鼠標繪制,代碼也很簡單,在map監聽的pointermove方法中,繼續創建一個draw進行繪制,關鍵代碼就是下面:
		draw = new Draw({
          source,  // 這個數據源就是我們最開始的那個數據源,這是簡寫,實際上是 source:source,
          type: 'LineString',  // 繪制線
          style: new Style({   // 繪制完成之前線的樣式,這是官網的樣式,需要的話自己可以修改成自己想要的樣子
            fill: new Fill({
              color: 'rgba(255, 255, 255, 0.2)',
            }),
            stroke: new Stroke({
              color: 'rgba(0, 0, 0, 0.5)',
              lineDash: [10, 10],
              width: 4,
            }),
            image: new CircleStyle({
              radius: 5,
              stroke: new Stroke({
                color: 'rgba(0, 0, 0, 0.7)',
              }),
              fill: new Fill({
                color: 'rgba(255, 255, 255, 0.2)',
              }),
            }),
          }),
        });
然后把draw綁定到地圖上面。
map.addInteraction(draw); // draw 綁定到地圖上面去
然后就實現了鼠標繪制線。
在我們點擊開始測量的時候呢,在我們拖動鼠標的時候,會在上方顯示出當前距離起點的距離,這個地方代碼實現就是下面的樣子,繼續在上面的代碼后面寫:
		// 開始監聽繪制
        draw.on('drawstart', (evt) => {
          feature = evt.feature;  // feature就是全局的
          let tooltipCoord = evt.coordinate;  // 鼠標當前的位置
          listener = feature.getGeometry().on('change', function (evt) {
            const geom = evt.target;
            let output = formatLength(geom);   // 距離的格式
            tooltipCoord = geom.getLastCoordinate();    // 設置鼠標位置改變后的實時位置
            measureTooltipElement.innerHTML = output;  // 設置提示框的內容,就是距離
            measureTooltip.setPosition(tooltipCoord);  // 設置距離提示框的位置
          });
        });

        // 格式化長度, 直接官網代碼
        const formatLength = function (line) {
          const length = getLength(line);
          let output;
          if (length > 100) {
            output = Math.round((length / 1000) * 100) / 100 + ' ' + 'km';
          } else {
            output = Math.round(length * 100) / 100 + ' ' + 'm';
          }
          return output;
        };

		this.createMeasureTooltip()  // 創建那個距離的提示框
然后上面代碼調用了一個方法。
	createMeasureTooltip() {
        if (measureTooltipElement) {
          measureTooltipElement.parentNode.removeChild(measureTooltipElement);
        }
        measureTooltipElement = document.createElement('div');
        measureTooltipElement.className = 'ol-tooltip ol-tooltip-measure';
        measureTooltip = new Overlay({
          element: measureTooltipElement,
          offset: [0, -15],
          positioning: 'bottom-center',
          stopEvent: false,
          insertFirst: false,
        });
        this.drawElements.push(measureTooltip)
        map.addOverlay(measureTooltip);
      },
完成上面的代碼之后,我們在點擊開始測量之后,會在鼠標上方實時顯示當前鼠標位置距離起點的距離。
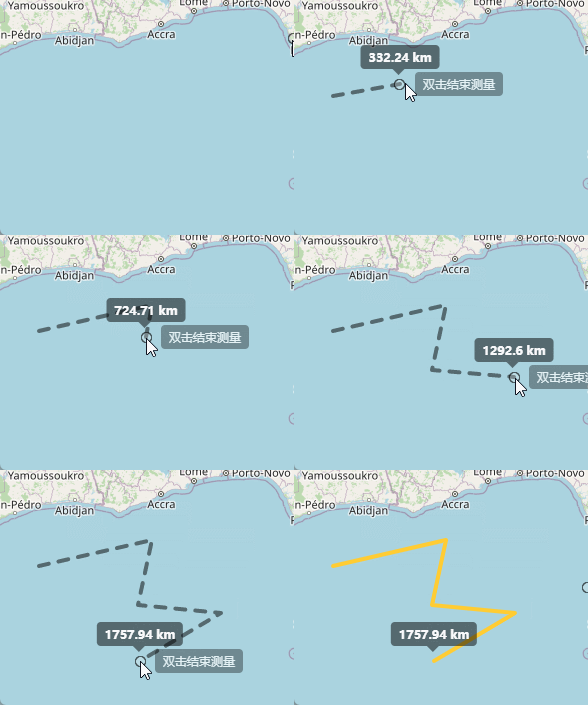
上邊已經實現了點擊開始測距,并且實時顯示距離信息,接下來就是雙擊完成時候顯示出總長度。
繼續在之前代碼后邊寫:
		// 雙擊繪制完成
        draw.on('drawend', () => {
          measureTooltipElement.className = 'ol-tooltip ol-tooltip-static';
          measureTooltip.setOffset([0, -7]);
          feature = null;
          measureTooltipElement = null;
          this.createMeasureTooltip();
          unByKey(listener);
        });
上邊的代碼基本上就是官網的代碼,但是變量名不一樣的地方需要稍微改一下。
通過上面的代碼就實現了雙擊測量完成的功能。
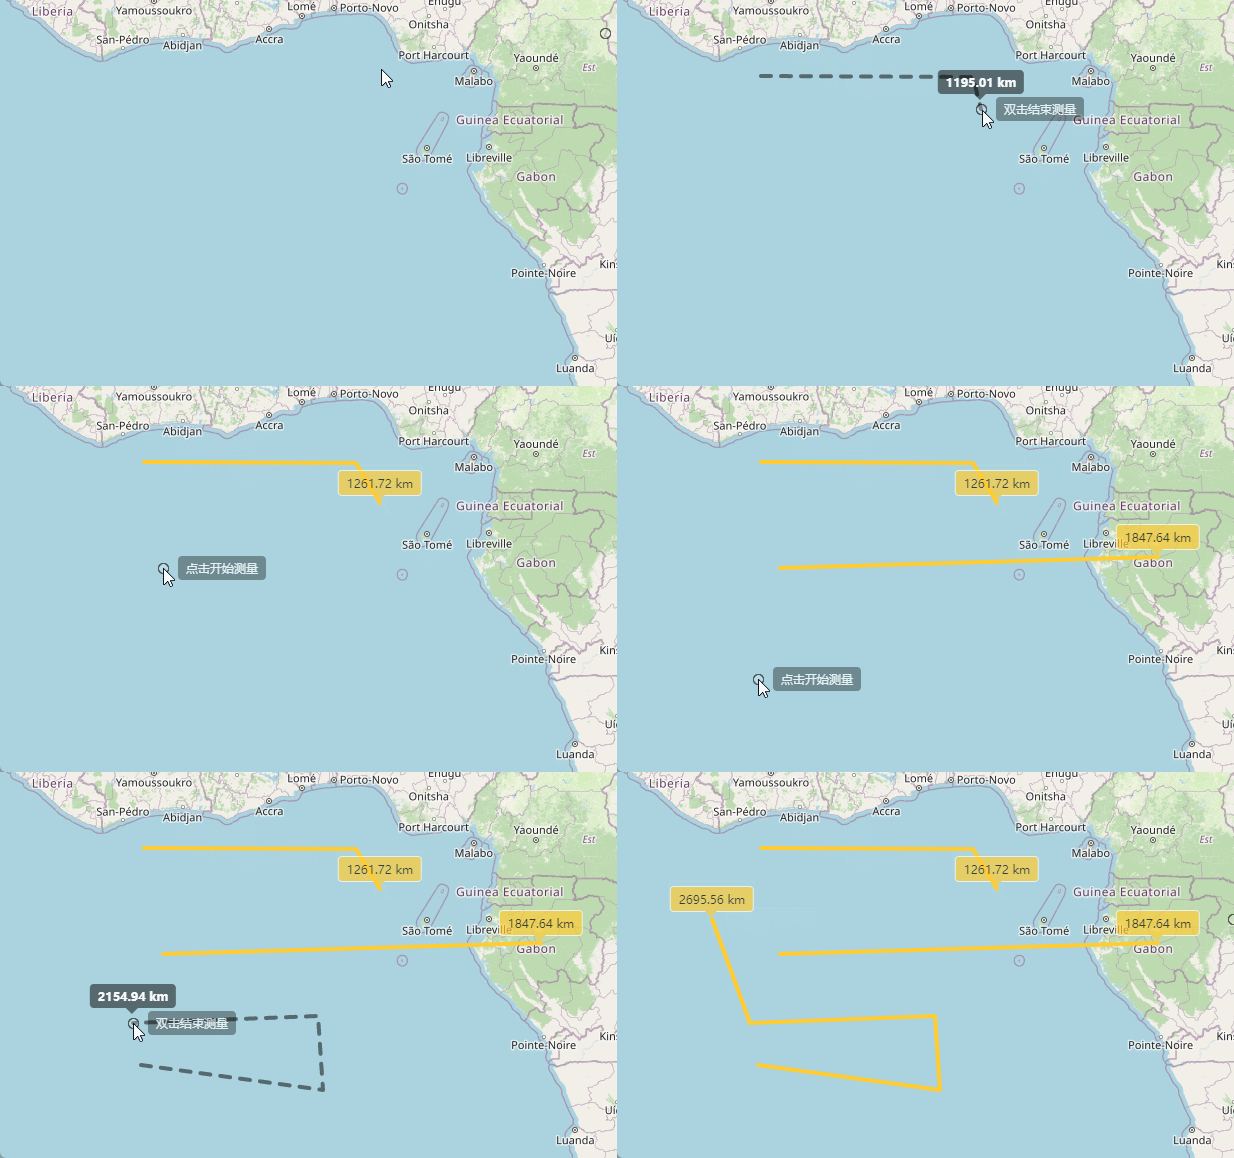
OK,到此為止,測距功能全部完成!
繪制功能完成了,就需要取消繪制,取消繪制需要在點擊“取消繪制”按鈕之后,取消地圖繪制功能,刪除界面上已經繪制過的內容。
首先我們需要刪除地圖上繪制過的內容,包括連線,以及彈窗。
這個地方需要注意一下,我們需要把繪制的圖層,比如連線,和彈窗都保存到一個或者是幾個列表里面,然后在點擊按鈕的時候,去遍歷刪除。
所以說我們要在點擊測距時候加載到地圖的圖層之后,將創建的圖層添加到一個數組存起來。
map.addLayer(layer)
this.drawLayers.push(layer)  // 保存起來
包括那個總距離的彈窗。
this.drawElements.push(measureTooltip)
map.addOverlay(measureTooltip);  // 保存起來
然后點擊“取消測量”按鈕的時候執行下面的代碼:
      // 取消繪制
      cancal() {
        for(let i = 0 ; i< this.drawLayers.length; i++) {
          map.removeLayer(this.drawLayers[i])
        }
        for (let i = 0; i < this.drawElements.length; i++) {
          map.removeOverlay(this.drawElements[i])
        }
        this.drawLayers = []
        this.drawElements = []
        map.removeInteraction(draw)
        unByKey(mapMouseMove);
      },
這樣就可以了。
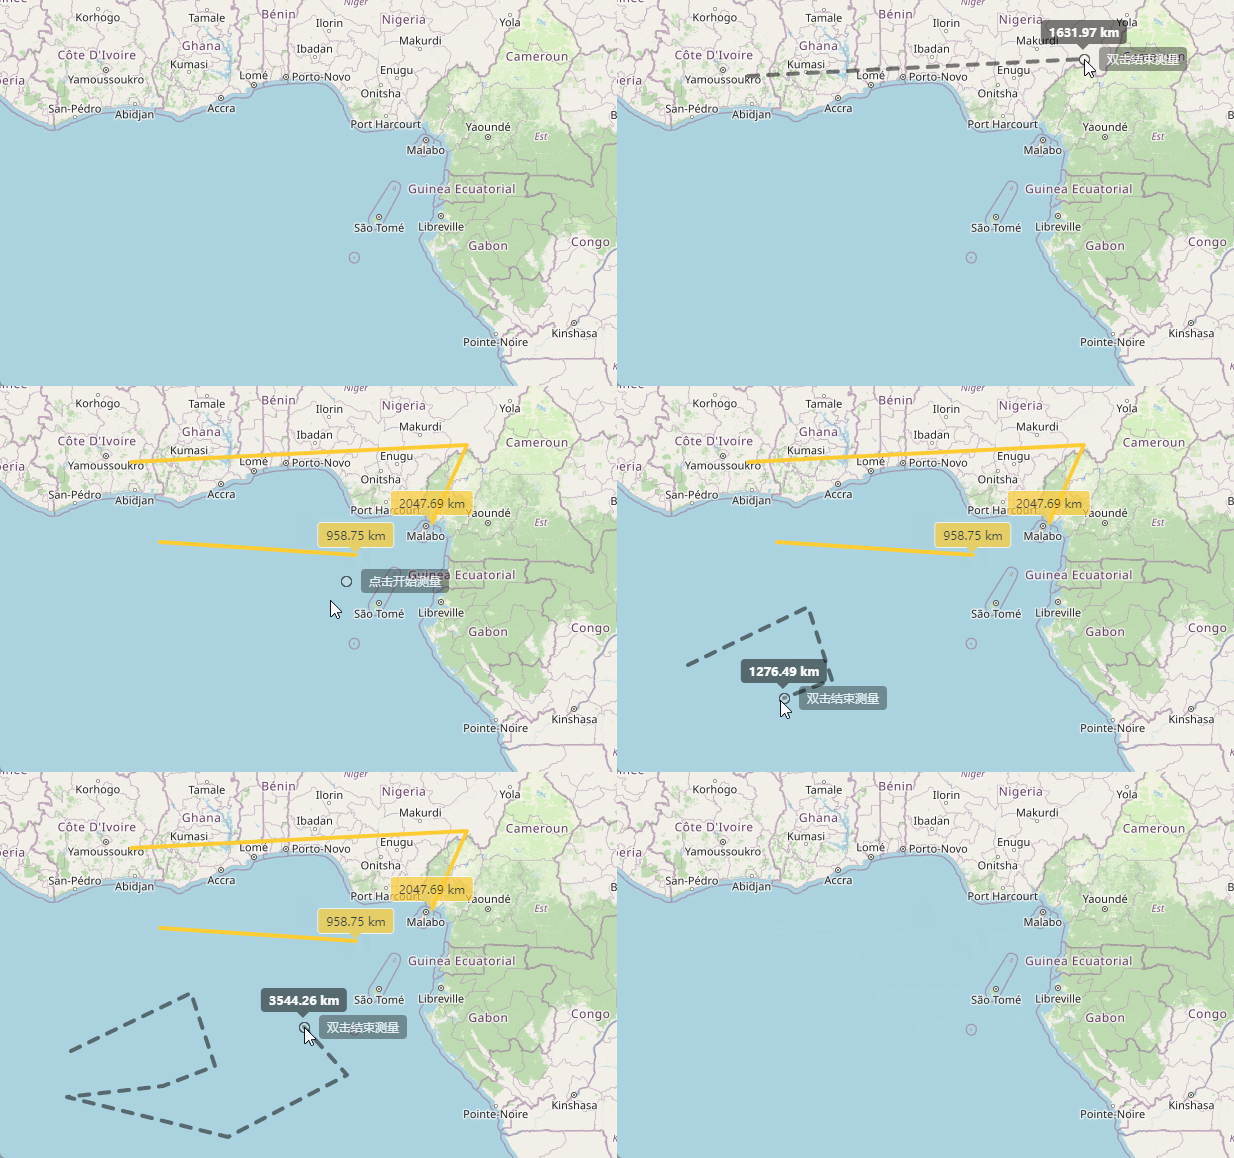
這樣就完成了!
這里分享一下全部代碼,就不放資源了,下載還花錢,我也是跟人家學的,沒必要都。
<template>
  <div class="home">
    <div class="set">
      <button class="btn" @click="distance()">測距</button>
      <button class="btn" @click="cancal()">取消</button>
    </div>
    <div id="map" ref="map"></div>
  </div>
</template>

<script>
  import 'ol/ol.css';
  import Draw from 'ol/interaction/Draw';
  import Map from 'ol/Map';
  import Overlay from 'ol/Overlay';
  import View from 'ol/View';
  import { Circle as CircleStyle, Fill, Stroke, Style } from 'ol/style';
  import { LineString, Polygon } from 'ol/geom';
  import { OSM, Vector as VectorSource } from 'ol/source';
  import { Tile as TileLayer, Vector as VectorLayer } from 'ol/layer';
  import { getArea, getLength } from 'ol/sphere';
  import { unByKey } from 'ol/Observable';

  var map = null

  var helpTooltipElement = null
  var feature = null;
  var helpTooltip = null;
  var draw = null;
  var measureTooltipElement = null;
  var measureTooltip = null;
  var listener = null;
  var mapMouseMove = null;

  export default {
    name: "Home",
    data() {
      return {
        drawLayers: [],
        drawElements: [],
      }
    },
    mounted() {
      this.initMap()
    },
    methods: {
      // 初始化地圖
      initMap() {

        map = new Map({
          layers: [
            new TileLayer({
              source: new OSM(),
            }),
          ],
          target: 'map',
          view: new View({
            center: [0, 0],
            zoom: 5,
            maxZoom: 18,
            // projection: 'EPSG:4326',
            constrainResolution: true,  // 設置縮放級別為整數
            smoothResolutionConstraint: false,  // 關閉無級縮放地圖
          }),
        });
      },


      // 測距
      distance() {

        let source = new VectorSource()
        const layer = new VectorLayer({
          source: source,
          style: new Style({
            fill: new Fill({
              color: 'rgba(255, 255, 255, 0.2)',
            }),
            stroke: new Stroke({
              color: '#ffcc33',
              width: 4,
            }),
            image: new CircleStyle({
              radius: 7,
              fill: new Fill({
                color: '#ffcc33',
              }),
            }),
          }),
        });

        mapMouseMove = map.on('pointermove', (ev) => {
          let helpMsg = '點擊開始測量'
          if (feature) {
            helpMsg = '雙擊結束測量'
          }
          helpTooltipElement.innerHTML = helpMsg;
          helpTooltip.setPosition(ev.coordinate);
          helpTooltipElement.classList.remove('hidden')

        })

        map.getViewport().addEventListener('mouseout', function () {
          helpTooltipElement.classList.add('hidden');
        });

        draw = new Draw({
          source,
          type: 'LineString',
          style: new Style({
            fill: new Fill({
              color: 'rgba(255, 255, 255, 0.2)',
            }),
            stroke: new Stroke({
              color: 'rgba(0, 0, 0, 0.5)',
              lineDash: [10, 10],
              width: 4,
            }),
            image: new CircleStyle({
              radius: 5,
              stroke: new Stroke({
                color: 'rgba(0, 0, 0, 0.7)',
              }),
              fill: new Fill({
                color: 'rgba(255, 255, 255, 0.2)',
              }),
            }),
          }),
        });

        // 開始堅挺繪制
        draw.on('drawstart', (evt) => {
          feature = evt.feature;

          let tooltipCoord = evt.coordinate;

          listener = feature.getGeometry().on('change', function (evt) {
            const geom = evt.target;
            let output = formatLength(geom);
            tooltipCoord = geom.getLastCoordinate();
            measureTooltipElement.innerHTML = output;
            measureTooltip.setPosition(tooltipCoord);
          });
        });

        // 雙擊繪制完成
        draw.on('drawend', () => {
          measureTooltipElement.className = 'ol-tooltip ol-tooltip-static';
          measureTooltip.setOffset([0, -7]);
          feature = null;
          measureTooltipElement = null;
          this.createMeasureTooltip();
          unByKey(listener);
        });

        // 格式化長度
        const formatLength = function (line) {
          const length = getLength(line);
          let output;
          if (length > 100) {
            output = Math.round((length / 1000) * 100) / 100 + ' ' + 'km';
          } else {
            output = Math.round(length * 100) / 100 + ' ' + 'm';
          }
          return output;
        };

        this.createHelpTooltip()
        this.createMeasureTooltip()
        map.addLayer(layer)
        this.drawLayers.push(layer)
        map.addInteraction(draw);
      },

      // 取消繪制
      cancal() {
        for(let i = 0 ; i< this.drawLayers.length; i++) {
          map.removeLayer(this.drawLayers[i])
        }
        for (let i = 0; i < this.drawElements.length; i++) {
          map.removeOverlay(this.drawElements[i])
        }
        this.drawLayers = []
        this.drawElements = []
        map.removeInteraction(draw)
        unByKey(mapMouseMove);
      },

      createMeasureTooltip() {
        if (measureTooltipElement) {
          measureTooltipElement.parentNode.removeChild(measureTooltipElement);
        }
        measureTooltipElement = document.createElement('div');
        measureTooltipElement.className = 'ol-tooltip ol-tooltip-measure';
        measureTooltip = new Overlay({
          element: measureTooltipElement,
          offset: [0, -15],
          positioning: 'bottom-center',
          stopEvent: false,
          insertFirst: false,
        });
        this.drawElements.push(measureTooltip)
        map.addOverlay(measureTooltip);
      },

      createHelpTooltip() {
        if (helpTooltipElement) {
          helpTooltipElement.parentNode.removeChild(helpTooltipElement);
        }
        helpTooltipElement = document.createElement('div');
        helpTooltipElement.className = 'ol-tooltip hidden';
        helpTooltip = new Overlay({
          element: helpTooltipElement,
          offset: [15, 0],
          positioning: 'center-left',
        });
        map.addOverlay(helpTooltip);
      },

    },
  };

</script>
<style scoped>
  .home {
    width: 100%;
    height: 100%;
    background-color: aliceblue;
    position: relative;
  }

  #map {
    height: 100%;
    width: 100%;
  }

  .set {
    position: absolute;
    top: 0px;
    right: 0px;
    z-index: 99;
  }

  .btn {
    margin: 10px;
  }

  /deep/.hidden {
    display: none;
  }

  /deep/.ol-tooltip {
    position: relative;
    background: rgba(0, 0, 0, 0.5);
    border-radius: 4px;
    color: white;
    padding: 4px 8px;
    opacity: 0.7;
    white-space: nowrap;
    font-size: 12px;
    cursor: default;
    user-select: none;
  }

  /deep/.ol-tooltip-measure {
    opacity: 1;
    font-weight: bold;
  }

  /deep/.ol-tooltip-static {
    background-color: #ffcc33;
    color: black;
    border: 1px solid white;
  }

  /deep/.ol-tooltip-measure:before,
  /deep/.ol-tooltip-static:before {
    border-top: 6px solid rgba(0, 0, 0, 0.5);
    border-right: 6px solid transparent;
    border-left: 6px solid transparent;
    content: "";
    position: absolute;
    bottom: -6px;
    margin-left: -7px;
    left: 50%;
  }

  /deep/.ol-tooltip-static:before {
    border-top-color: #ffcc33;
  }
</style>
到此,相信大家對“Vue+OpenLayer怎么實現測距功能”有了更深的了解,不妨來實際操作一番吧!這里是億速云網站,更多相關內容可以進入相關頻道進行查詢,關注我們,繼續學習!
免責聲明:本站發布的內容(圖片、視頻和文字)以原創、轉載和分享為主,文章觀點不代表本網站立場,如果涉及侵權請聯系站長郵箱:is@yisu.com進行舉報,并提供相關證據,一經查實,將立刻刪除涉嫌侵權內容。