您好,登錄后才能下訂單哦!
您好,登錄后才能下訂單哦!
這篇文章主要介紹Python如果實現圖形繪制,文中介紹的非常詳細,具有一定的參考價值,感興趣的小伙伴們一定要看完!
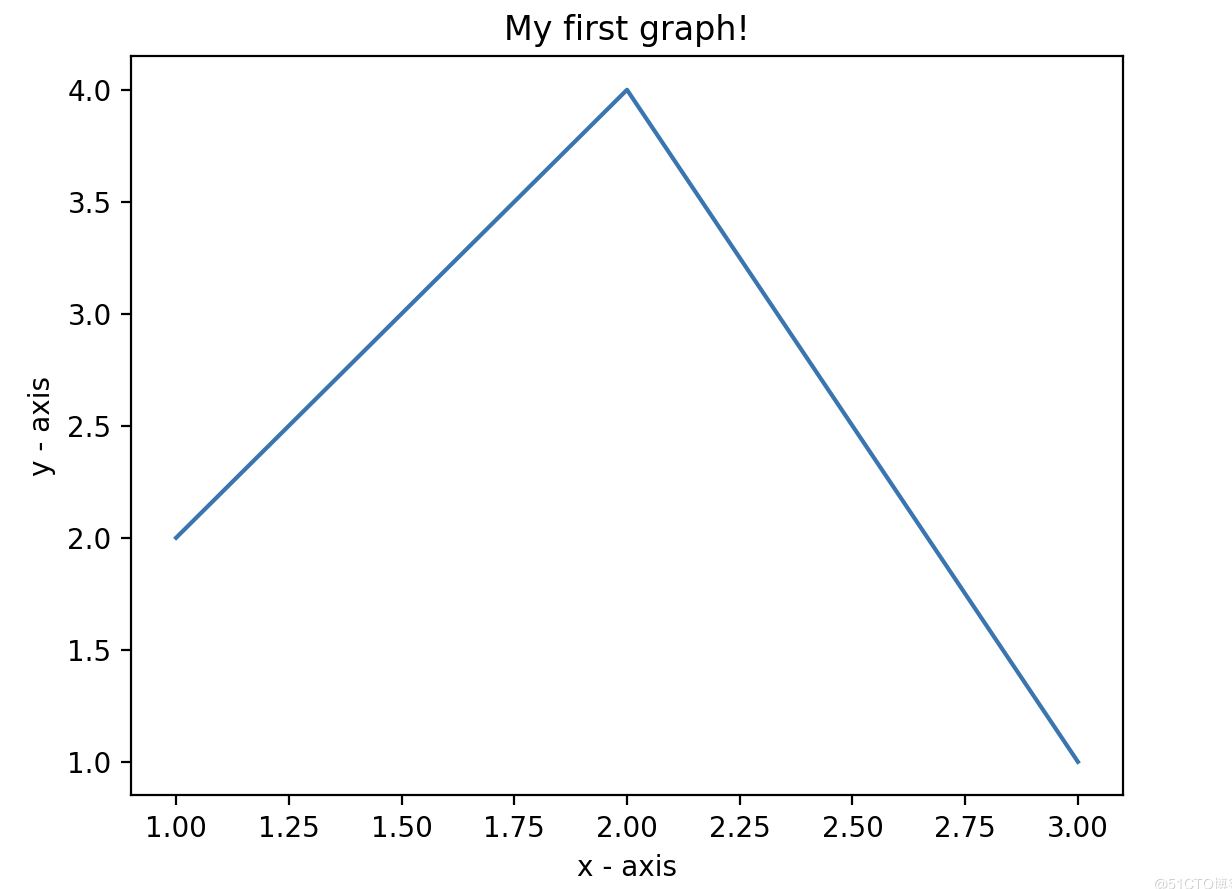
第一個圖形從簡單的開始。
# importing the required module

import matplotlib.pyplot as plt


# x axis values

x = [1,2,3]

# corresponding y axis values

y = [2,4,1]


# plotting the points

plt.plot(x, y)


# naming the x axis

plt.xlabel('x - axis')

# naming the y axis

plt.ylabel('y - axis')


# giving a title to my graph

plt.title('My first graph!')


# function to show the plot

plt.show()
1)將 x 軸和相應的 y 軸值定義為列表。
2)使用 .plot() 函數在畫布上繪制它們。
3)使用 .xlabel() 和 .ylabel() 函數為 x 軸和 y 軸命名。
4)使用 .title() 函數為繪圖命名。
5)使用 .show() 函數查看繪圖。
2、在同一圖上繪制兩條或多條線
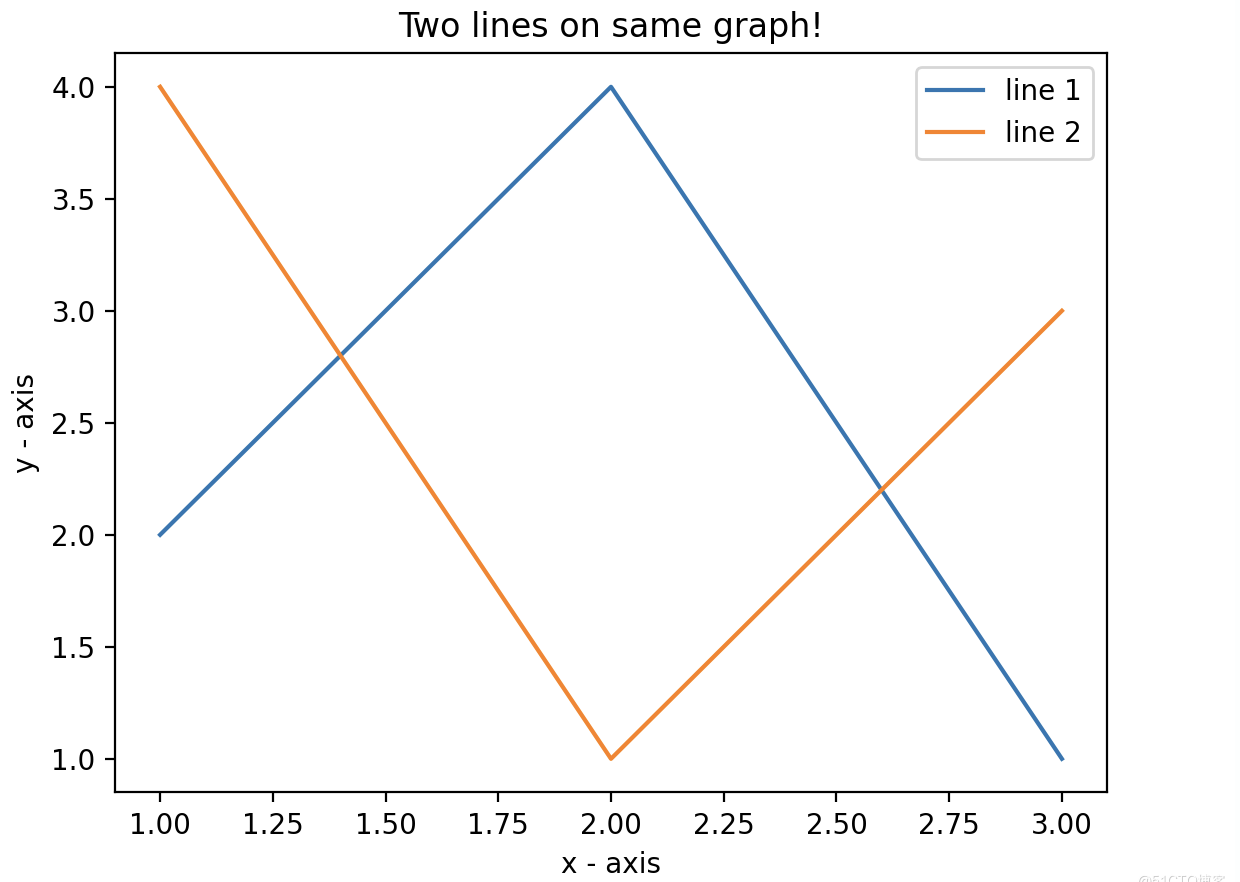
如果想在同一張圖上再繪制多條線,可反復使用.plot()函數。
import matplotlib.pyplot as plt


# line 1 points

x1 = [1,2,3]

y1 = [2,4,1]

# plotting the line 1 points

plt.plot(x1, y1, label = "line 1")


# line 2 points

x2 = [1,2,3]

y2 = [4,1,3]

# plotting the line 2 points

plt.plot(x2, y2, label = "line 2")


# naming the x axis

plt.xlabel('x - axis')

# naming the y axis

plt.ylabel('y - axis')

# giving a title to my graph

plt.title('Two lines on same graph!')


# show a legend on the plot

plt.legend()


# function to show the plot

plt.show()
1)在同一張圖上繪制兩條線。 通過給它們一個名稱(label)來區分它們,該名稱作為 .plot() 函數的參數傳遞。
2)提供有關線條類型及其顏色信息的小矩形框稱為圖例。 可以使用 .legend() 函數為繪圖添加圖例。
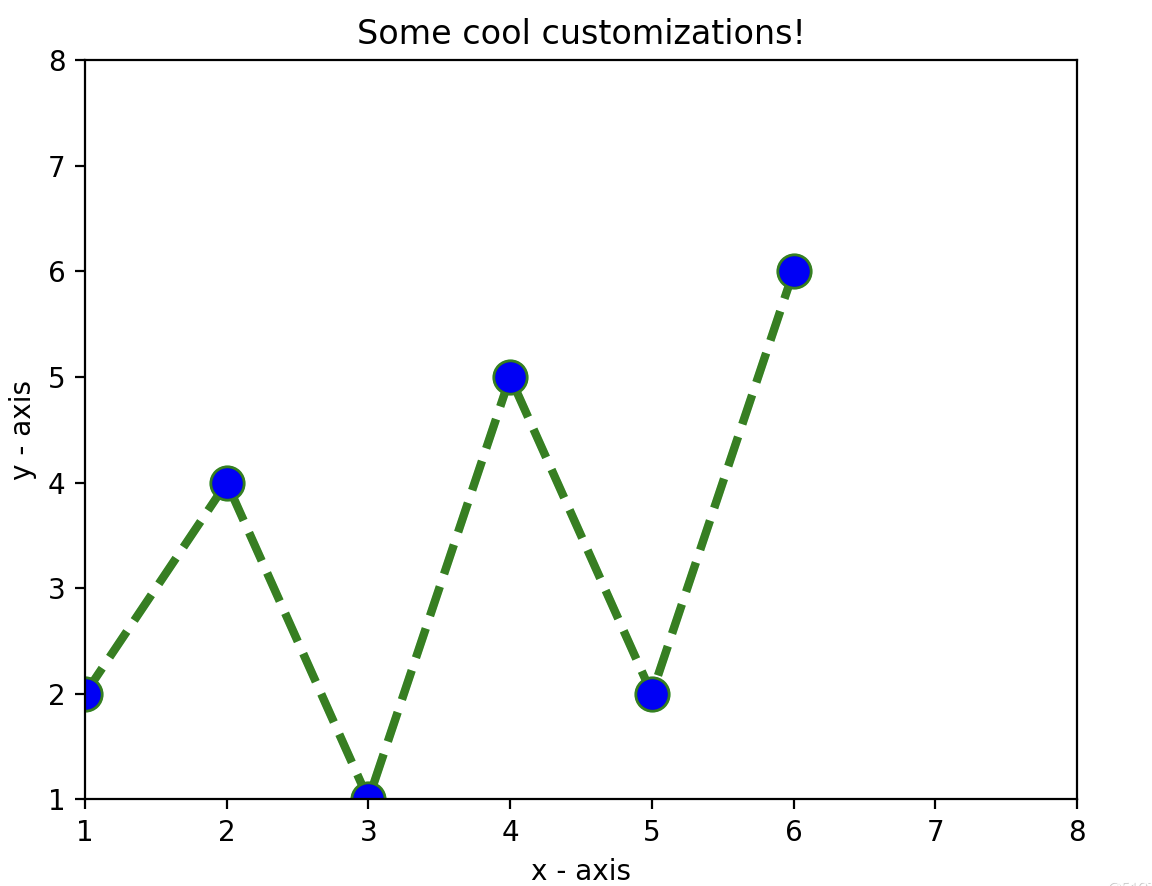
下面將討論適用于幾乎所有場景的一些基本自定義。
import matplotlib.pyplot as plt


# x axis values

x = [1,2,3,4,5,6]

# corresponding y axis values

y = [2,4,1,5,2,6]


# plotting the points

plt.plot(x, y, color='green', linestyle='dashed', linewidth = 3,marker='o', markerfacecolor='blue', markersize=12)


# setting x and y axis range

plt.ylim(1,8)

plt.xlim(1,8)


# naming the x axis

plt.xlabel('x - axis')

# naming the y axis

plt.ylabel('y - axis')


# giving a title to my graph

plt.title('Some cool customizations!')


# function to show the plot

plt.show()
如上面代碼所示,我們進行了一些自定義的改變:
1)設定線的寬度、樣式以及顏色。
2)設定了標記的形狀、顏色和尺寸。
3)覆蓋 x 和 y 軸范圍。如果未完成覆蓋,pyplot 模塊使用自動縮放功能來設置軸范圍和比例。
以上是“Python如果實現圖形繪制”這篇文章的所有內容,感謝各位的閱讀!希望分享的內容對大家有幫助,更多相關知識,歡迎關注億速云行業資訊頻道!
免責聲明:本站發布的內容(圖片、視頻和文字)以原創、轉載和分享為主,文章觀點不代表本網站立場,如果涉及侵權請聯系站長郵箱:is@yisu.com進行舉報,并提供相關證據,一經查實,將立刻刪除涉嫌侵權內容。