您好,登錄后才能下訂單哦!
您好,登錄后才能下訂單哦!
本文小編為大家詳細介紹“echarts折線圖流動特效怎么實現”,內容詳細,步驟清晰,細節處理妥當,希望這篇“echarts折線圖流動特效怎么實現”文章能幫助大家解決疑惑,下面跟著小編的思路慢慢深入,一起來學習新知識吧。

echarts官網:series-lines
注意:流動特效只支持非平滑曲線(smooth:false)
series-lines路徑圖:
用于帶有起點和終點信息的線數據的繪制,主要用于地圖上的航線,路線的可視化。
ECharts 2.x 里會用地圖上的 markLine 去繪制遷徙效果,在 ECharts 3 里建議使用單獨的 lines 類型圖表。
一些參數:
series-lines.coordinateSystem :該系列使用的坐標系,可選:
‘cartesian2d’-使用二維的直角坐標系(也稱笛卡爾坐標系),通過 xAxisIndex, yAxisIndex指定相應的坐標軸組件。
‘geo’-使用地理坐標系,通過 geoIndex 指定相應的地理坐標系組件。
series-lines.polyline:是否是多段線。
默認為 false,只能用于繪制只有兩個端點的線段,線段可以通過 lineStyle.curveness 配置為曲線。
如果該配置項為 true,則可以在 data.coords 中設置多于 2 個的頂點用來繪制多段線,在繪制路線軌跡的時候比較有用,見示例 北京公交路線,設置為多段線后 lineStyle.curveness 無效。
series-lines.effect. show:是否顯示特效。
series-lines.effect. period = 4。 特效動畫的時間,單位為 s。
series-lines.effect. symbol = ‘circle’。特效圖形的標記。
ECharts 提供的標記類型包括’circle’, ‘rect’, ‘roundRect’, ‘triangle’, ‘diamond’, ‘pin’, ‘arrow’, 'none’可以通過 ‘image://url’ 設置為圖片,其中 URL 為圖片的鏈接,或者 dataURI。
series-lines.effect. symbolSize = 3。特效標記的大小,可以設置成諸如 10 這樣單一的數字,也可以用數組分開表示高和寬,例如 [20, 10] 表示標記寬為20,高為10。
series-lines.effect. trailLength = 0.2。特效尾跡的長度。取從 0 到 1 的值,數值越大尾跡越長。
series-lines.effect. loop = true。是否循環顯示特效。
series-lines.data. coords :一個包含兩個到多個二維坐標的數組。在 polyline 設置為 true 時支持多于兩個的坐標。
eg:
[
 {
    coords: [
      ["測1", 222],
      ["測2", 932],
      ["測3", 66],
      ["測4", 934],
      ["測5", 111],
      ["測6", 333],
      ["測7", 0],
    ],
  },
];data. coords的獲取:
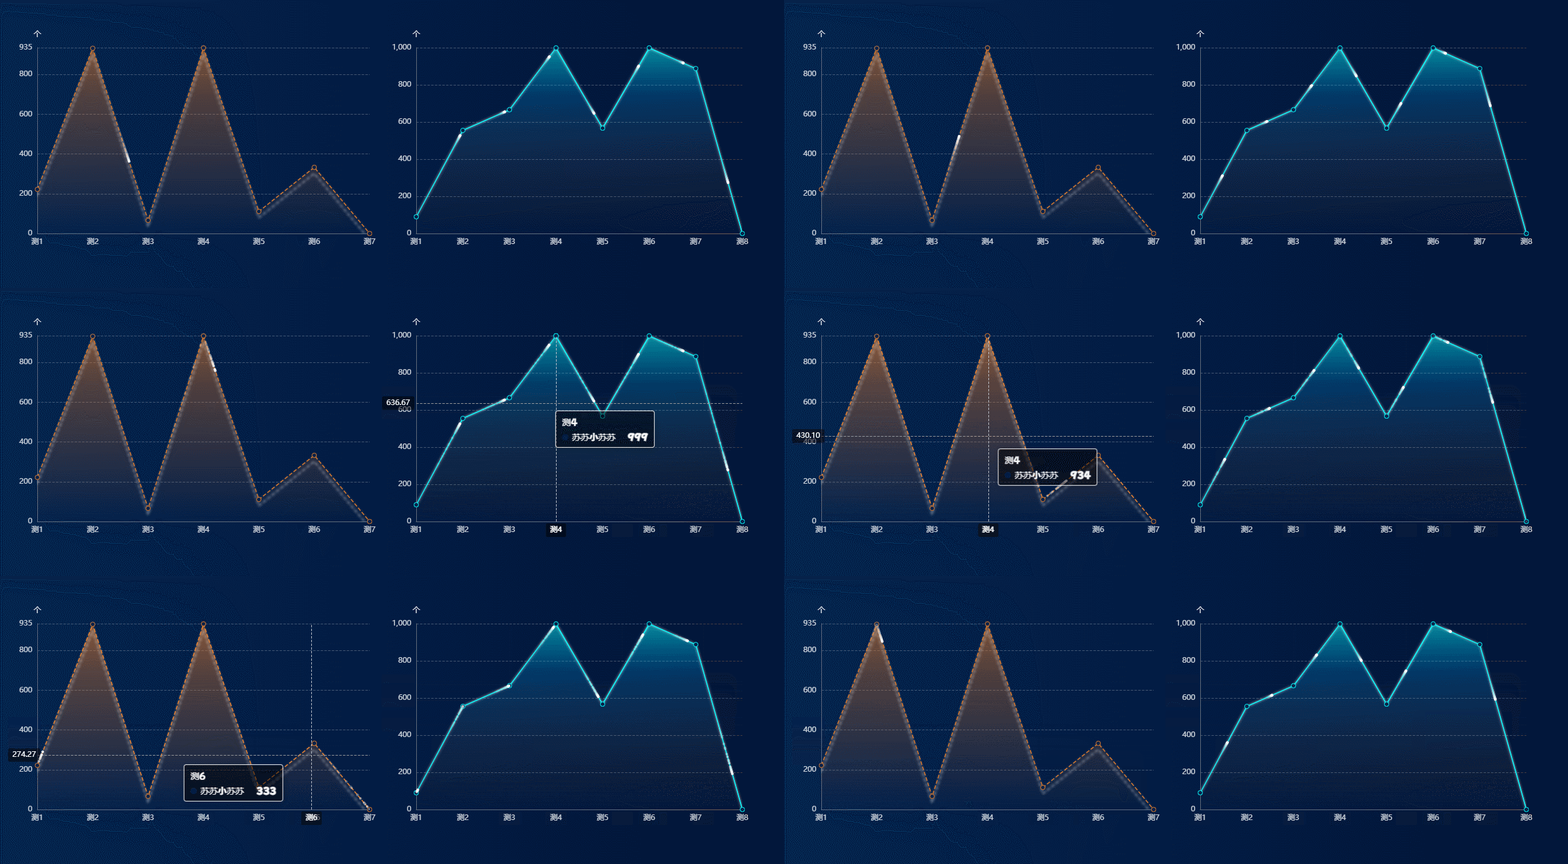
//多線段(polyline=true),如圖左側連續一段:
let yData = [222, 932, 66, 934, 111, 333, 0],
  xData = ["測1", "測2", "測3", "測4", "測5", "測6", "測7"],
   datacoords = [
     {
       coords: [],
     },
   ];
 for (var i = 0; i < xData.length; i++) {
   datacoords[0].coords.push([xData[i], yData[i]]);
 }
//單線段(polyline=false),如圖右側各段展示:
let yData = [90, 555, 666, 999, 567, 999, 888, 0],
xData = ["測1", "測2", "測3", "測4", "測5", "測6", "測7", "測8"],
datacoords = [];
for (var i = 0; i < xData.length; i++) {
datacoords.push([
{
coord: [i, yData[i]],
},
{
coord: [i + 1, yData[i + 1]],
},
]);
}setOption設置:
 this.charts.setOption({
   animation: true, //控制動畫示否開啟
   animationDuration: 3000,
   animationEasing: "bounceOut", //緩動動畫
   animationThreshold: 8, //動畫元素的閾值
   backgroundColor: "transparent", // 給echarts圖設置背景色
   tooltip: {
     trigger: "axis",
     backgroundColor: "rgba(0,0,0,.5)",
     axisPointer: {
       type: "cross",
       label: {
         backgroundColor: "rgba(0,0,0,.5)",
       },
     },
     textStyle: {
       color: "#fff",
       fontSize: 14,
     },
   },
   grid: {
     left: "3%", //圖表距邊框的距離
     right: "3%",
     top: "15%",
     bottom: "5%",
     containLabel: true,
   },
   xAxis: [
     {
       nameGap: 3,
       nameTextStyle: {
         color: "rgba(255,255,255,.8)",
         fontSize: 12,
       },
       type: "category",
       data: xData,
       boundaryGap: false, //從0開始
       axisLine: {
         onZero: true,
         rotate: 30, //坐標軸內容過長旋轉
         interval: 1,
         lineStyle: {
           color: "#636E7C",
         },
       },
       axisLabel: {
         color: "rgba(255,255,255,.8)", //坐標的字體顏色
         fontSize: 12,
       },
       axisTick: {
         //坐標軸刻度顏色  x和y不交叉
         show: false,
       },
     },
   ],
   yAxis: [
     {
       name: "個",
       min: 0,
       max: function (value) {
         return Math.ceil(value.max / 5) * 5;
       },
       splitNumber: 5,
       type: "value",
       nameTextStyle: {
         color: "rgba(255,255,255,.89)",
         fontSize: 12,
       },
       splitLine: {
         show: true,
         lineStyle: {
           color: "rgba(255,255,255,.25)",
           type: "dashed",
         },
       },
       axisTick: {
         //坐標軸刻度顏色
         show: false,
       },
       axisLine: {
         //坐標軸線顏色
         show: true,
         lineStyle: {
           color: "#636E7C",
         },
       },
       axisLabel: {
         color: "rgba(255,255,255,.8)", //坐標的字體顏色
         fontSize: 12,
       },
     },
   ],
   series: [
     {
       name: "蘇蘇小蘇蘇",
       type: "line",
       smooth: false,
       lineStyle: {
         color: "#DC7828",
         width: 1.5,
         type: "dashed",
         shadowOffsetX: 0, // 折線的X偏移
         shadowOffsetY: 10, // 折線的Y偏移
         shadowBlur: 4, // 折線模糊
         shadowColor: "rgba(255, 255, 255, 0.8)", //設置折線陰影顏色
       },
       showSymbol: true, //是否默認展示圓點
       symbol: "circle", // 默認是空心圓(中間是白色的)
       symbolSize: 7,
       itemStyle: {
         color: "#021E47", //實圓的背景色
         borderWidth: 1,
         borderColor: "#DC7828",
       },
       areaStyle: {
         color: new echarts.graphic.LinearGradient(0, 1, 0, 0, [
           {
             offset: 1,
             color: "rgba(220,120,40,0.8)",
           },
           {
             offset: 0.74,
             color: "rgba(220,120,40,0.5)",
           },
           {
             offset: 0,
             color: "rgba(220,120,40,0)",
           },
         ]),
       },
       emphasis: {
         focus: "series",
       },
       data: yData,
     },
     {
       showSymbol: false,
       name: "蘇蘇小蘇蘇",
       type: "lines",
       polyline: true,
       smooth: false,
       coordinateSystem: "cartesian2d",
       zlevel: 1,
       effect: {
         show: true,
         smooth: true,
         period: 6,
         symbolSize: 4,
       },
       lineStyle: {
         color: "#fff",
         width: 1,
         opacity: 0,
         curveness: 0,
         cap: "round",
       },
       data: datacoords,
     },
   ],
 });
讀到這里,這篇“echarts折線圖流動特效怎么實現”文章已經介紹完畢,想要掌握這篇文章的知識點還需要大家自己動手實踐使用過才能領會,如果想了解更多相關內容的文章,歡迎關注億速云行業資訊頻道。
免責聲明:本站發布的內容(圖片、視頻和文字)以原創、轉載和分享為主,文章觀點不代表本網站立場,如果涉及侵權請聯系站長郵箱:is@yisu.com進行舉報,并提供相關證據,一經查實,將立刻刪除涉嫌侵權內容。