溫馨提示×
您好,登錄后才能下訂單哦!
點擊 登錄注冊 即表示同意《億速云用戶服務條款》
您好,登錄后才能下訂單哦!
本文小編為大家詳細介紹“Vue中怎么使用js制作進度條式數據對比動畫”,內容詳細,步驟清晰,細節處理妥當,希望這篇“Vue中怎么使用js制作進度條式數據對比動畫”文章能幫助大家解決疑惑,下面跟著小編的思路慢慢深入,一起來學習新知識吧。
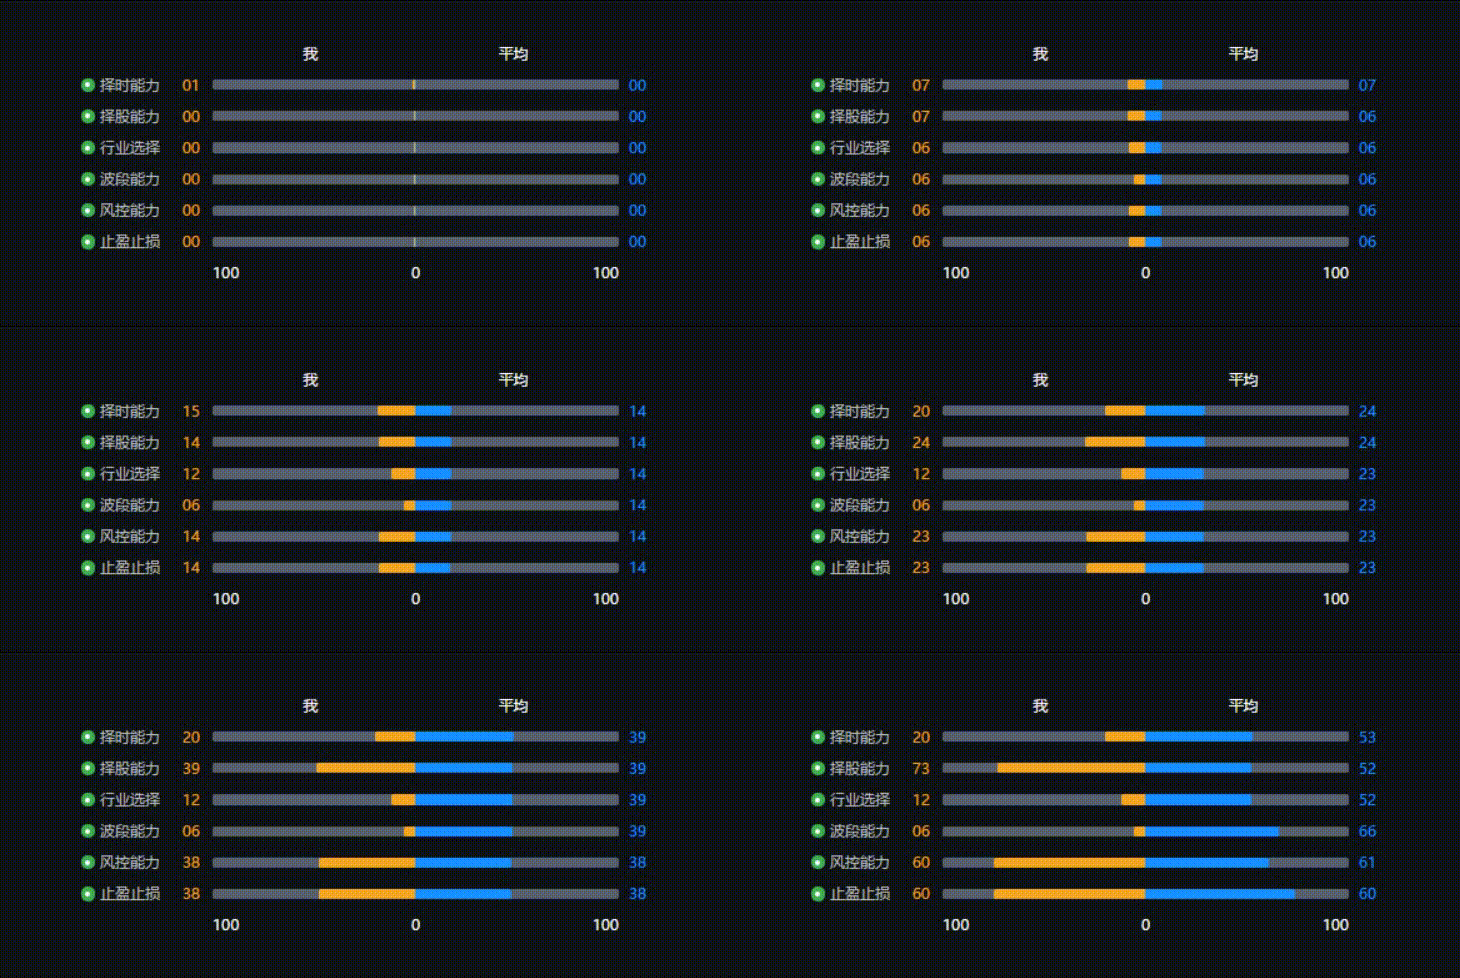
實現的效果:(初始化以及瀏覽器resize的時候兩側的條形為向兩側遞增的動畫,其中兩端的數字也是遞增的動畫)

HTML部分:
<div class="no-ivatargo-chart-b">
  <div class="investment-ability">
    <div class="title">
      <span>您的投資能力分析</span>
    </div>
    <div class="investment-ability-picture-outer-container">
      <div class="investment-ability-picture-container">
        <div class="investment-ability-picture-header"
             ref="allLine">
          <span>我</span>
          <span>平均</span>
        </div>
        <div class="investment-ability-picture"
             v-for="(item, index) in abilityArr"
             :key="index">
          <div class="investment-ability-picture-top">
            <div class="investment-left">
              <div class="left-icon-outer">
                <div class="left-icon-inner"></div>
              </div>
              <span>{{item.title}}</span>
            </div>
            <div class="investment-right">
              <div class="investment-info">
                <span class="my-color">{{item.score | scoreFilter}}</span>
                <div class="all-line">
                  <div class="my-line"
                       :></div>
                  <div class="other-line"
                       :></div>
                </div>
                <span class="average-color">{{item.average | scoreFilter}}</span>
              </div>
            </div>
          </div>
        </div>
        <div class="investment-ability-picture-footer">
          <span>100</span>
          <span>0</span>
          <span>100</span>
        </div>
      </div>
    </div>
  </div>
</div>
filters: {
scoreFilter (val) {
if (!isNaN(val)) {
return Number(val) < 10 ? `0${parseInt(val)}` : parseInt(val)
} else {
return ''
}
}
}CSS部分:
.no-ivatargo-chart-b {
  width: 100%;
  overflow: hidden;
  display: flex;
  flex-direction: column;
  font-size: 14.76px;
  color: #bfbfbf;
  background-color: #0f1318;
  .title {
    display: flex;
    align-items: center;
    font-size: 17.22px;
    color: #bfbfbf;
    margin-bottom: 15px;
  }
  .investment-ability-picture-header {
    width: 400px;
    margin-left: 130px;
    display: flex;
    align-items: center;
    justify-content: space-around;
    margin-bottom: 10px;
    color: #fff;
  }
  .investment-ability-picture-outer-container {
    display: flex;
    justify-content: center;
    align-items: center;
    height: calc(100% - 50px);
    .investment-ability-picture-container {
      display: flex;
      flex-direction: column;
      .investment-ability-picture {
        display: flex;
        flex-direction: column;
        margin-bottom: 10px;
        .investment-ability-picture-top {
          display: flex;
          .investment-left {
            font-size: 14.76px;
            color: #bfbfbf;
            width: 100px;
            display: flex;
            align-items: center;
            .left-icon-outer {
              width: 14px;
              height: 14px;
              background-color: #3fb050;
              border-radius: 50%;
              position: relative;
              margin-right: 5px;
              .left-icon-inner {
                position: absolute;
                width: 5px;
                height: 5px;
                top: 50%;
                left: 50%;
                transform: translate(-50%, -50%);
                background-color: #fff;
                border-radius: 50%;
              }
            }
          }
          .investment-right {
            display: flex;
            align-items: center;
            justify-content: space-between;
            .investment-info {
              display: flex;
              align-items: center;
              justify-content: space-between;
              .all-line {
                width: 400px;
                height: 10px;
                background-color: #57606e;
                border-radius: 2px;
                margin-left: 10px;
                margin-right: 10px;
                position: relative;
                .my-line {
                  width: 0;
                  height: 10px;
                  position: absolute;
                  top: 0;
                  right: 200px;
                  background-color: #f5a623;
                  border-top-left-radius: 2px;
                  border-bottom-left-radius: 2px;
                }
                .other-line {
                  width: 0;
                  height: 10px;
                  position: absolute;
                  top: 0;
                  left: 200px;
                  background-color: #1890ff;
                  border-top-right-radius: 2px;
                  border-bottom-right-radius: 2px;
                }
              }
              .my-color {
                width: 20px;
                color: #f5a623;
              }
              .average-color {
                width: 20px;
                color: #1890ff;
              }
            }
          }
        }
        .investment-ability-picture-bottom {
          display: flex;
          flex-direction: column;
          background-color: #ccc;
          width: 400px;
          margin-left: 130px;
          padding: 5px;
          color: #000;
        }
      }
    }
  }
  .investment-ability-picture-footer {
    width: 400px;
    margin-left: 130px;
    display: flex;
    align-items: center;
    justify-content: space-between;
    color: #fff;
  }
}
JS部分:
1.子組件當中
mounted () {
  let that = this
  window.onresize = () => {
    clearTimeout(that.resizeTimer)
    that.resizeTimer = setTimeout(() => {
      that.handleGetAllWidth()
    }, 1000)
  }
  this.$nextTick(() => {
    clearTimeout(this.resizeTimerB)
    this.resizeTimerB = setTimeout(() => {
      this.handleGetAllWidth()
    }, 200)
  })
}

// methods當中
handleGetAllWidth () {
  this.$emit('getAllWidth', this.$refs.allLine.offsetWidth)
}
2.父組件當中
getAllLineWidth (data) {
  this.allLineWidth = data
  this.calculateIvatargo()
},
// 給條形圖添加計算寬度,并形成動畫
calculateIvatargo () {
  this.myTimerArr.forEach((value, index) => {
    clearInterval(value)
  })
  this.averageTimerArr.forEach((value, index) => {
    clearInterval(value)
  })
  this.myTimerArr = []
  this.averageTimerArr = []
  let myVal = []
  let averageVal = []
  this.myAbilityArr.forEach((value, index) => {
    myVal[index] = 0
    averageVal[index] = 0
    this.myTimerArr[index] = setInterval(() => {
      if (myVal[index] > Number(this.allLineWidth) * Number(value.score) / 200 || !value.score) {
        clearInterval(this.myTimerArr[index])
        value.score ? myVal[index] = Number(this.allLineWidth) * Number(value.score) / 200 : myVal[index] = 0
        this.$set(value, 'myWidth', myVal[index] + 'px')
        this.$set(value, 'myNum', value.score)
      } else {
        myVal[index]++
        this.$set(value, 'myWidth', myVal[index] + 'px')
        this.$set(value, 'myNum', myVal[index] / 2)
      }
    }, 5)
    this.averageTimerArr[index] = setInterval(() => {
      if (averageVal[index] > Number(this.allLineWidth) * Number(value.average) / 200 || !value.average) {
        clearInterval(this.averageTimerArr[index])
        value.average ? averageVal[index] = Number(this.allLineWidth) * Number(value.average) / 200 : averageVal[index] = 0
        this.$set(value, 'averageWidth', averageVal[index] + 'px')
        this.$set(value, 'averageNum', value.average)
      } else {
        averageVal[index]++
        this.$set(value, 'averageWidth', averageVal[index] + 'px')
        this.$set(value, 'averageNum', averageVal[index] / 2)
      }
    }, 5)
  })
}
讀到這里,這篇“Vue中怎么使用js制作進度條式數據對比動畫”文章已經介紹完畢,想要掌握這篇文章的知識點還需要大家自己動手實踐使用過才能領會,如果想了解更多相關內容的文章,歡迎關注億速云行業資訊頻道。
免責聲明:本站發布的內容(圖片、視頻和文字)以原創、轉載和分享為主,文章觀點不代表本網站立場,如果涉及侵權請聯系站長郵箱:is@yisu.com進行舉報,并提供相關證據,一經查實,將立刻刪除涉嫌侵權內容。