您好,登錄后才能下訂單哦!
您好,登錄后才能下訂單哦!
這篇文章主要介紹如何利用Python實現隨機相對強弱指數StochRSI,文中介紹的非常詳細,具有一定的參考價值,感興趣的小伙伴們一定要看完!
隨機相對強弱指數簡稱為StochRSI,是一種技術分析指標,用于確定資產是否處于超買或超賣狀態,也用于確定當前市場的態勢。顧名思義,StochRSI是標準相對強弱指數(RSI)的衍生,因此被視為是一種能夠衡量指數的指數。它是一種振蕩器,在中心線的上方和下方波動。
StochRSI最初是在1994年由Stanley Kroll和Tushar Chande撰寫的題為《The NewTechnical Trader》的書中描述。它經常被股票交易者使用。
通過應用隨機振蕩器生成公式,從標準RSI生成StochRSI。其生成結果是單個數字評級,圍繞中心線(0.5)在0-1的值域范圍內上下擺動。但是,StochRSI的修改版本將結果乘以100,因此該值是介于0和100之間而不是0和1之間。通常還會參考3天內的簡單移動平均線(SMA)以及StochRSI趨勢,作為信號線,旨在降低虛假信號交易的風險。
標準隨機震蕩指數公式取決于資產的收盤價以及設定周期內的最高價和最低價。但是,當使用公式計算StochRSI時,它直接使用RSI數據(不考慮價格)。
Stoch RSI = (Current RSI - Lowest RSI)/(Highest RSI - Lowest RSI)
與標準RSI一樣,StochRSI使用的最常見時間周期為14。StochRSI計算中涉及的14個周期基于圖表時間范圍。因此,每日圖表會顯示過去14天(K線圖),每小時圖表會顯示過去14小時生成的StochRSI。
周期可以設置為幾天、幾小時甚至幾分鐘,并且它們的使用方式也因交易者而異(根據他們的情況和策略而定)。還可以向上或向下調整周期數,以確定長期或短期趨勢。將周期值設置為20,是StochRSI指標一個相當受歡迎的選擇。
如上所述,某些StochRSI圖表模式指定的范圍值為0到100而不是0到1。在這些圖表中,中心線為50而不是0.5。因此,通常在0.8處出現的超買信號將表示為80,而超賣信號表示為20而不是0.2。具有0-100設置的圖表可能看起來略有不同,但實際原理解釋是基本相同的。
StochRSI指數如果出現在其范圍的上限和下限附近,此時的意義是最重大的。因此,該指標的主要用途是確定潛在的買入和賣出點,以及價格發生的逆轉。因此,0.2或以下的數值,會表明資產可能發生超賣,而0.8或以上的數值則表明該資產可能會發生超買。
此外,更接近中心線的數值也可以為交易者提供有關市場趨勢的信息。例如,當中心線作為支撐線并且StochRSI線穩定移動到0.5以上時,尤其是數值趨近于0.8,則可能表明其繼續看漲或呈上升趨勢。同樣,當數值始終低于0.5,趨近于0.2時,則表明下跌或呈下降趨勢趨勢。
我們將通過 Python 中的回測來介紹 RSI 和 StochRSI 這兩種方法。
最常見的 StochRSI 策略基于均值回歸。與 RSI 一樣,StochRSI 通常使用 80 來表示做空的超買水平,使用 20 來表示要買入的超賣水平。此外,14 天的回顧和平滑期很常見。出于我們的目的,我們將堅持使用這些標準值。
現在編寫代碼,讓我們在 Python 中導入一些標準包。
import numpy as np
import pandas as pd
import matplotlib.pyplot as plt
import yfinance as yf
接下來,我們將構建一個函數來計算我們的指標。我們將其稱為 calcStochRSI(),它將依靠一些函數來計算 RSI 和隨機振蕩器,以獲得我們選擇的指標。
def calcRSI(data, P=14):
  # Calculate gains and losses
  data['diff_close'] = data['Close'] - data['Close'].shift(1)
  data['gain'] = np.where(data['diff_close']>0,
    data['diff_close'], 0)
  data['loss'] = np.where(data['diff_close']<0,
    np.abs(data['diff_close']), 0)
  # Get initial values
  data[['init_avg_gain', 'init_avg_loss']] = data[
    ['gain', 'loss']].rolling(P)
  # Calculate smoothed avg gains and losses for all t > P
  avg_gain = np.zeros(len(data))
  avg_loss = np.zeros(len(data))
  for i, _row in enumerate(data.iterrows()):
    row = _row[1]
    if i < P - 1:
      last_row = row.copy()
      continue
    elif i == P-1:
      avg_gain[i] += row['init_avg_gain']
      avg_loss[i] += row['init_avg_loss']
    else:
      avg_gain[i] += ((P - 1) * avg_gain[i] +
            row['gain']) / P
      avg_loss[i] += ((P - 1) * avg_loss[i] +
            row['loss']) / P
    last_row = row.copy()
  data['avg_gain'] = avg_gain
  data['avg_loss'] = avg_loss
  # Calculate RS and RSI
  data['RS'] = data['avg_gain'] / data['avg_loss']
  data['RSI'] = 100 - 100 / (1 + data['RS'])
  return data
def calcStochOscillator(data):
  data['low_N'] = data['RSI'].rolling(N).min()
  data['high_N'] = data['RSI'].rolling(N).max()
  data['StochRSI'] = 100 * (data['RSI'] - data['low_N']) / \
    (data['high_N'] - data['low_N'])
  return data
def calcStochRSI(data, P=14, N=14):
  data = calcRSI(data)
  data = calcStochOscillator(data)
  return data
def calcReturns(df):
  # Helper function to avoid repeating too much code
  df['returns'] = df['Close'] / df['Close'].shift(1)
  df['log_returns'] = np.log(df['returns'])
  df['strat_returns'] = df['position'].shift(1) * df['returns']
  df['strat_log_returns'] = df['position'].shift(1) * df['log_returns']
  df['cum_returns'] = np.exp(df['log_returns'].cumsum()) - 1
  df['strat_cum_returns'] = np.exp(df['strat_log_returns'].cumsum()) - 1
  df['peak'] = df['cum_returns'].cummax()
  df['strat_peak'] = df['strat_cum_returns'].cummax()
  return df
有了這些功能,我們只需要為我們的策略構建邏輯就可以了。還要注意,我們有一個名為 calcReturns 的輔助函數,我們可以快速將其應用于回測的結果以從中獲取所有返回值。
這意味著回歸模型將在 StochRSI 高于 80 時做空或賣出,并在低于 20 時買入。
def StochRSIReversionStrategy(data, P=14, N=14, short_level=80,
  buy_level=20, shorts=True):
  '''Buys when the StochRSI is oversold and sells when it's overbought'''
  df = calcStochRSI(data, P, N)
  df['position'] = np
  df['position'] = np.where(df['StochRSI']<buy_level, 1, df['position'])
  if shorts:
    df['position'] = np.where(df['StochRSI']>short_level, -1, df['position'])
  else:
    df['position'] = np.where(df['StochRSI']>short_level, 0, df['position'])
  df['position'] = df['position'].ffill()
  return calcReturns(df)
table = pd.read_html('https://en.wikipedia.org/wiki/List_of_S%26P_500_companies')
df = table[0]
syms = df['Symbol']
# Sample symbols
# ticker = np.random.choice(syms.values)
ticker = "BSX"
print(f"Ticker Symbol: {ticker}")
start = '2000-01-01'
end = '2020-12-31'
# Get Data
yfyfObj = yf.Ticker(ticker)
data = yfObj.history(startstart=start, endend=end)
data.drop(['Open', 'High', 'Low', 'Volume', 'Dividends',
    'Stock Splits'], inplace=True, axis=1)
# Run test
df_rev = StochRSIReversionStrategy(data.copy())
# Plot results
colors = plt.rcParams['axes.prop_cycle'].by_key()['color']
fig, ax = plt.subplots(2, figsize=(12, 8))
ax[0].plot(df_rev['strat_cum_returns']*100, label='Mean Reversion')
ax[0].plot(df_rev['cum_returns']*100, label='Buy and Hold')
ax[0].set_ylabel('Returns (%)')
ax[0].set_title('Cumulative Returns for Mean Reversion and' +
                f' Buy and Hold Strategies for {ticker}')
ax[0].legend(bbox_to_anchor=[1, 0.6])
ax[1].plot(df_rev['StochRSI'], label='StochRSI', linewidth=0.5)
ax[1].plot(df_rev['RSI'], label='RSI', linewidth=1)
ax[1].axhline(80, label='Over Bought', color=colors[1], linestyle=':')
ax[1].axhline(20, label='Over Sold', color=colors[2], linestyle=':')
ax[1].axhline(50, label='Centerline', color='k', linestyle=':')
ax[1].set_ylabel('Stochastic RSI')
ax[1].set_xlabel('Date')
ax[1].set_title(f'Stochastic RSI for {ticker}')
ax[1].legend(bbox_to_anchor=[1, 0.75])
plt.tight_layout()
plt.show()
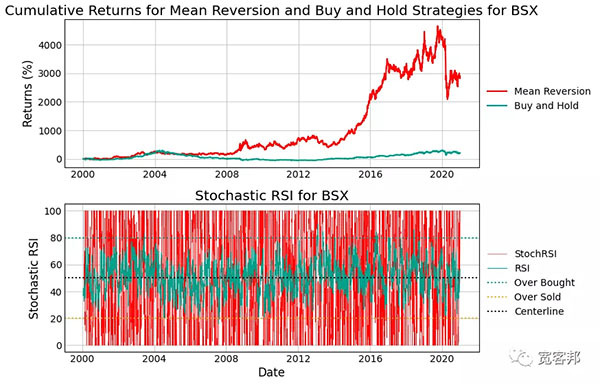
在我們研究的 21 年期間,均值回歸策略擊敗了Boston Scientific(BSX)的買入和持有策略,回報率為 28 倍,而后者為 2 倍。
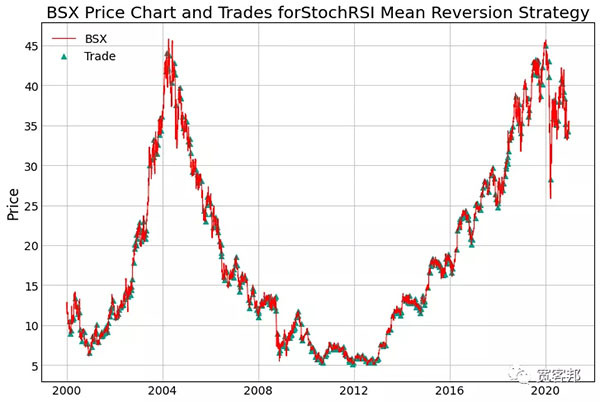
在第二個圖中顯示了 StochRSI 和一些關鍵指標。我還添加了 RSI 以與更不穩定的 StochRSI 進行比較。這導致交易頻繁,如果您的賬戶較小且交易成本相對較高,這可能會嚴重影響您的實際回報。我們只是在一個工具上運行它,所以最終進行了 443 筆交易,或者每 12 天交易一次,這看起來并不多。但是,如果我們要使用該指標管理適當的工具組合并頻繁進行交易,我們每天可能會進出多筆交易,交易成本會變得很高。
# Get trades
diff = df_rev['position'].diff().dropna()
trade_idx = diff.index[np.where(diff!=0)]
fig, ax = plt.subplots(figsize=(12, 8))
ax.plot(df_rev['Close'], linewidth=1, label=f'{ticker}')
ax.scatter(trade_idx, df_rev[trade_idx]['Close'], c=colors[1],
           marker='^', label='Trade')
ax.set_ylabel('Price')
ax.set_title(f'{ticker} Price Chart and Trades for' +
             'StochRSI Mean Reversion Strategy')
ax.legend()
plt.show()
要查看整體策略的一些關鍵指標,讓我們看看使用以下 getStratStats 函數。
def getStratStats(log_returns: pd.Series, risk_free_rate: float = 0.02):
  stats = {}
  # Total Returns
  stats['tot_returns'] = np.exp(log_returns.sum()) - 1
  # Mean Annual Returns
  stats['annual_returns'] = np.exp(log_returns.mean() * 252) - 1
  # Annual Volatility
  stats['annual_volatility'] = log_returns * np.sqrt(252)
  # Sortino Ratio
  annualized_downside = log_returns.loc[log_returns<0].std() * np.sqrt(252)
  stats['sortino_ratio'] = (stats['annual_returns'] - risk_free_rate) \
    / annualized_downside
  # Sharpe Ratio
  stats['sharpe_ratio'] = (stats['annual_returns'] - risk_free_rate) \
    / stats['annual_volatility']
  # Max Drawdown
  cum_returns = log_returns.cumsum() - 1
  peak = cum_returns.cummax()
  drawdown = peak - cum_returns
  stats['max_drawdown'] = drawdown.max()
  # Max Drawdown Duration
  strat_dd = drawdown[drawdown==0]
  strat_ddstrat_dd_diff = strat_dd.index[1:] - strat_dd.index[:-1]
  strat_dd_days = strat_dd_diff.map(lambda x: x.days)
  strat_dd_days = np.hstack([strat_dd_days,
      (drawdown.index[-1] - strat_dd.index[-1]).days])
  stats['max_drawdown_duration'] = strat_dd_days.max()
  return stats
rev_stats = getStratStats(df_rev['strat_log_returns'])
bh_stats = getStratStats(df_rev['log_returns'])
pd.concat([pd.DataFrame(rev_stats, index=['Mean Reversion']),
           pd.DataFrame(bh_stats, index=['Buy and Hold'])])
在這里,我們看到該策略的回報率為 28 倍,而基礎資產的年度波動率大致相同。此外,根據 Sortino 和 Sharpe Ratios 衡量,我們有更好的風險調整回報。
在 2020 年的新冠疫情中,我們確實看到了均值回歸策略的潛在問題之一。該策略的總回報大幅下降,因為該策略的定位是向上回歸,但市場繼續低迷,該模型只是保持不變 . 它恢復了其中的一部分,但在這次測試中從未達到過疫情之前的高點。正確使用止損有助于限制這些巨大的損失,并有可能增加整體回報。
我們之前提到的另一個基本策略是使用 StochRSI 作為動量指標。當指標穿過中心線時,我們會根據其方向買入或做空股票。
def StochRSIMomentumStrategy(data, P=14, N=14,
  centerline=50, shorts=True):
  '''
  Buys when the StochRSI moves above the centerline,
  sells when it moves below
  '''
  df = calcStochRSI(data, P)
  df['position'] = np.nan
  df['position'] = np.where(df['StochRSI']>50, 1, df['position'])
  if shorts:
     df['position'] = np.where(df['StochRSI']<50, -1, df['position'])
  else:
    df['position'] = np.where(df['StochRSI']<50, 0, df['position'])
  df['position'] = df['position'].ffill()
  return calcReturns(df)
運行我們的回測:
# Run test
df_mom = StochRSIMomentumStrategy(data.copy())
# Plot results
colors = plt.rcParams['axes.prop_cycle'].by_key()['color']
fig, ax = plt.subplots(2, figsize=(12, 8))
ax[0].plot(df_mom['strat_cum_returns']*100, label='Momentum')
ax[0].plot(df_mom['cum_returns']*100, label='Buy and Hold')
ax[0].set_ylabel('Returns (%)')
ax[0].set_title('Cumulative Returns for Momentum and' +
                f' Buy and Hold Strategies for {ticker}')
ax[0].legend(bbox_to_anchor=[1, 0.6])
ax[1].plot(df_mom['StochRSI'], label='StochRSI', linewidth=0.5)
ax[1].plot(df_mom['RSI'], label='RSI', linewidth=1)
ax[1].axhline(50, label='Centerline', color='k', linestyle=':')
ax[1].set_ylabel('Stochastic RSI')
ax[1].set_xlabel('Date')
ax[1].set_title(f'Stochastic RSI for {ticker}')
ax[1].legend(bbox_to_anchor=[1, 0.75])
plt.tight_layout()
plt.show()
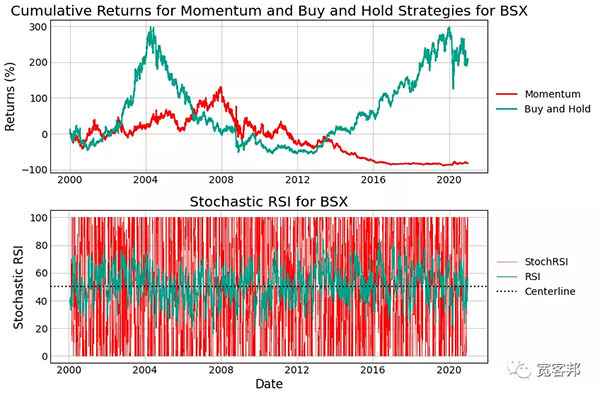
在這種情況下,我們的動量策略表現非常糟糕,在我們假設的時間段內幾乎損失了我們所有的初始投資。
查看我們策略的統計數據,該模型的唯一優勢是比買入并持有方法的回撤時間略短。
mom_stats = getStratStats(df_mom['strat_log_returns'])
bh_stats = getStratStats(df_mom['log_returns'])
pd.concat([pd.DataFrame(mom_stats, index=['Momentum']),
           pd.DataFrame(rev_stats, index=['Mean Reversion']),
           pd.DataFrame(bh_stats, index=['Buy and Hold'])])
這并不意味著StochRSI 不適合此類應用。一次糟糕的回測并不意味著該策略毫無價值。相反,一個很好的回測并不意味著你有一些你應該立即開始交易的東西。我們需要與其他指標結合使用以改善結果。
以上是“如何利用Python實現隨機相對強弱指數StochRSI”這篇文章的所有內容,感謝各位的閱讀!希望分享的內容對大家有幫助,更多相關知識,歡迎關注億速云行業資訊頻道!
免責聲明:本站發布的內容(圖片、視頻和文字)以原創、轉載和分享為主,文章觀點不代表本網站立場,如果涉及侵權請聯系站長郵箱:is@yisu.com進行舉報,并提供相關證據,一經查實,將立刻刪除涉嫌侵權內容。