溫馨提示×
您好,登錄后才能下訂單哦!
點擊 登錄注冊 即表示同意《億速云用戶服務條款》
您好,登錄后才能下訂單哦!
這篇文章主要講解了“怎么用vue制作橫向斜切柱狀圖”,文中的講解內容簡單清晰,易于學習與理解,下面請大家跟著小編的思路慢慢深入,一起來研究和學習“怎么用vue制作橫向斜切柱狀圖”吧!
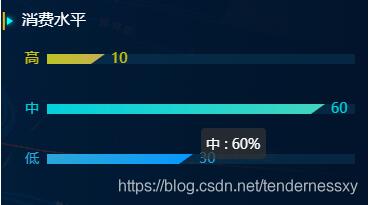
本文實例為大家分享了vue實現橫向斜切柱狀圖的具體代碼,供大家參考,具體內容如下
實現效果:

實現代碼:
<template>
  <div class="Consumption">
    <div  ref="ConsumptionChart" />
  </div>
</template>
<script>
import echarts from 'echarts'
const myShape = {
  x: 0,
  y: 0,
  width: 10 //間距
}
// 繪制左側面
const InclinedRoofBar = echarts.graphic.extendShape({
  shape: myShape,
  buildPath: function(ctx, shape) {
    // 會canvas的應該都能看得懂,shape是從custom傳入的
    const xAxisPoint = shape.xAxisPoint
    const c0 = [shape.x, shape.y]
    const c1 = [shape.x + 14, shape.y - 10]
    const c2 = [xAxisPoint[0], xAxisPoint[1] - 10]
    const c3 = [xAxisPoint[0], xAxisPoint[1]]
    ctx
      .moveTo(c0[0], c0[1])
      .lineTo(c1[0], c1[1])
      .lineTo(c2[0], c2[1])
      .lineTo(c3[0], c3[1])
      .closePath()
  }
})
const colors = ['rgba(50, 197, 255, 0.8)', 'rgba(0, 253, 255, 0.8)', 'rgba(255, 235, 0, 0.8)']
const colorss = ['rgba(0, 145, 255, 1)', 'rgba(68, 215, 182, 1)', 'rgba(215, 170, 68, 1)']
// 注冊三個面圖形
echarts.graphic.registerShape('InclinedRoofBar', InclinedRoofBar)
const defaultOption = {
  tooltip: {
    show: true,
    trigger: 'axis',
    axisPointer: {
      type: 'shadow'
    }
  },
  grid: {
    top: 10,
    bottom: 30,
    left: 10,
    right: 10,
    containLabel: true
  },
  yAxis: {
    type: 'category',
    data: [],
    axisLine: {
      show: false
    },
    axisTick: {
      show: false
    },
    axisLabel: {
      color(value, index) {
        return colorss[index]
      },
      fontSize: 14
    }
  },
  xAxis: {
    type: 'value',
    axisLine: {
      show: false
    },
    min: 0,
    splitLine: {
      show: false
    },
    axisTick: {
      show: false
    },
    axisLabel: {
      show: false
    },
    boundaryGap: ['20%', '20%']
  },
  series: [
    {
      type: 'custom',
      name: '',
      itemStyle: {
        color: 'rgba(44, 197, 253, 1)'
      },
      renderItem: (params, api) => {
       const location = api.coord([api.value(0), api.value(1)])
        const xlocation = api.coord([0, api.value(1)])
        return {
          type: 'InclinedRoofBar',
          shape: {
            api,
            xValue: api.value(0),
            yValue: api.value(1),
            x: location[0],
            y: location[1] + myShape.width,
            xAxisPoint: [xlocation[0], xlocation[1] + myShape.width]
          },
          style: {
            fill: new echarts.graphic.LinearGradient(0, 0, 1, 0, [
              {
                offset: 0,
                color: colors[params.dataIndex]
              },
              {
                offset: 1,
                color: colorss[params.dataIndex]
              }
            ])
          }
        }
      },
      data: []
    },
    {
      type: 'bar',
      label: {
        normal: {
          show: true,
          position: 'right',
          fontSize: 14,
          offset: [15, 0]
        }
      },
      showBackground: false,
      barWidth: 14,
      backgroundStyle: {
        color: 'rgba(50, 197, 255, 0.1)'
      },
      itemStyle: {
        color: 'transparent'
      },
      tooltip: {
        show: false
      },
      data: []
    }
  ]
}
export default {
  data() {
    return {
      myChart: null
    }
  },
  mounted() {
    this.myChart = echarts.init(this.$refs.ConsumptionChart)
  },
  methods: {
    getOption(seriesData) {
      const option = defaultOption
      const { yAxis, series } = option
      // 處理數據
      yAxis.data = ['低', '中', '高']
      series[0].data = seriesData
      series[1].data = seriesData.map((item, index) => Object.assign(item, { label: { color: colorss[index] } }))
      this.myChart.setOption(option)
    }
  }
}
</script>
感謝各位的閱讀,以上就是“怎么用vue制作橫向斜切柱狀圖”的內容了,經過本文的學習后,相信大家對怎么用vue制作橫向斜切柱狀圖這一問題有了更深刻的體會,具體使用情況還需要大家實踐驗證。這里是億速云,小編將為大家推送更多相關知識點的文章,歡迎關注!
免責聲明:本站發布的內容(圖片、視頻和文字)以原創、轉載和分享為主,文章觀點不代表本網站立場,如果涉及侵權請聯系站長郵箱:is@yisu.com進行舉報,并提供相關證據,一經查實,將立刻刪除涉嫌侵權內容。