您好,登錄后才能下訂單哦!
您好,登錄后才能下訂單哦!
R語言可視化中多系列柱形圖與分面組圖美化技巧有哪些,很多新手對此不是很清楚,為了幫助大家解決這個難題,下面小編將為大家詳細講解,有這方面需求的人可以來學習下,希望你能有所收獲。
今天跟大家分享多系列與分面組圖的美化技巧!
昨天講的關于多序列柱形圖與條形圖美化技巧,其實還漏掉了一些一點兒。
當數據序列比較多的時候,特別是超過四個以后,還用堆積柱形圖(條形圖)、或者簇狀柱形圖的話,圖表必然會因為系列太多而受到擠壓或者變形,整體就會不協調、不美觀。
還有ggplot不支持次坐標軸功能,它的作圖思維基本源于塔夫脫的可視化理念,而且作者個人的審美也接受次坐標軸(大牛任性),但是他留給大家解決多序列圖表的方案是——分面組圖~
data<-data.frame(Name = c("蘋果","谷歌","臉書","亞馬遜","騰訊"),Conpany = c("Apple","Google","Facebook","Amozon","Tencent"),Sale2013 = c(5000,3500,2300,2100,3100),Sale2014 = c(5050,3800,2900,2500,3300),Sale2015 = c(5050,3800,2900,2500,3300),Sale2016 = c(5050,3800,2900,2500,3300))
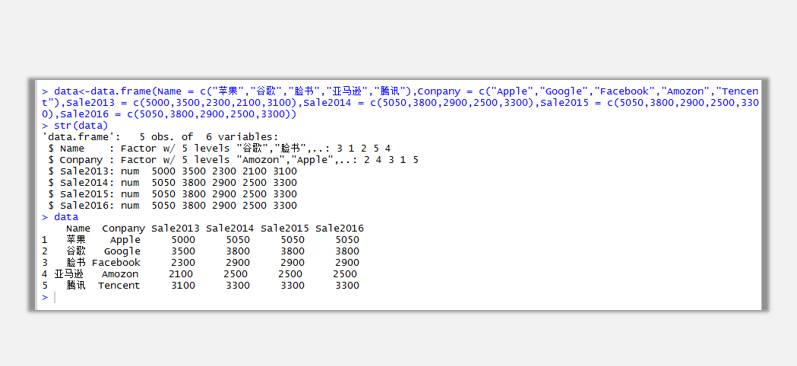
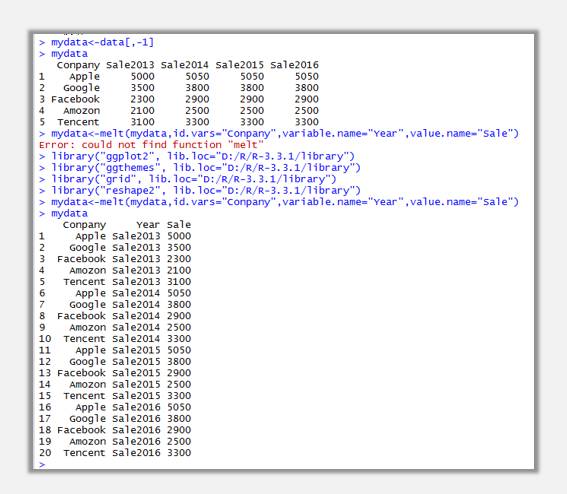
數據重塑(寬轉長):
mydata<-melt(mydata,id.vars="Conpany",variable.name="Year",value.name="Sale")
作圖函數:
ggplot(mydata,aes(Conpany,Sale,fill=Year))+geom_bar(stat="identity",position="dodge")
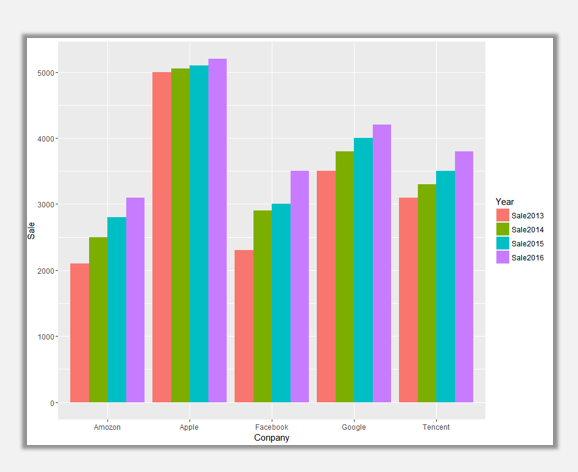
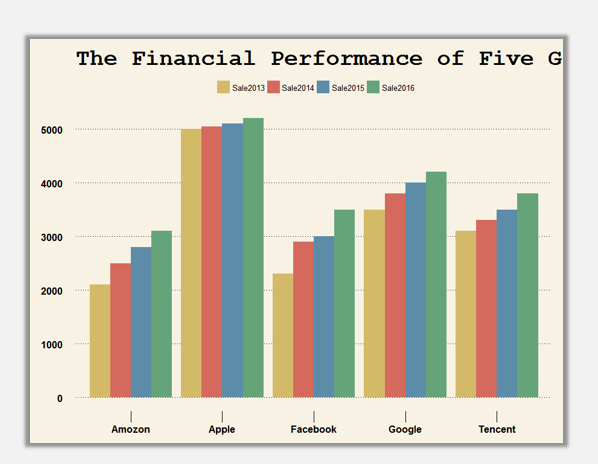
默認圖表的配色確實挺難看的,這里我們使用華爾街日報、經濟學人的主題、及配色模板。
ggplot(mydata,aes(Conpany,Sale,fill=Year))+geom_bar(stat="identity",position="dodge")+theme_wsj()+scale_fill_wsj("rgby", "")+theme(axis.ticks.length=unit(0.5,'cm'))+guides(fill=guide_legend(title=NULL))+ggtitle("The Financial Performance of Five Giant")+theme(axis.title = element_blank())
ggplot(mydata,aes(Conpany,Sale,fill=Year))+geom_bar(stat="identity",position="dodge")+theme_economist(base_size=14)+scale_fill_economist()+theme(axis.ticks.length=unit(0.5,'cm'))+guides(fill=guide_legend(title=NULL))+ggtitle("The Financial Performance of Five Giant")+theme(axis.title = element_blank())
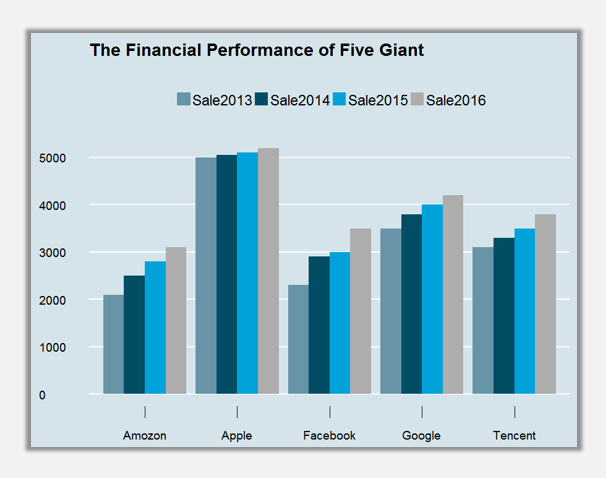
以上是我們使用傳統的方法通過將顏色映射到不同類別的年度收入變量上,達到了區分效果,可是這樣終究不是辦法,五個序列實在是有點多,已經讓然有點兒眼花繚亂了,如果有8個序列、10個序列呢,那又該怎么辦呢~
下面跟大家將其中一種比較有效的解決辦法:通過分面組圖解決多序列圖表:
橫排分面:
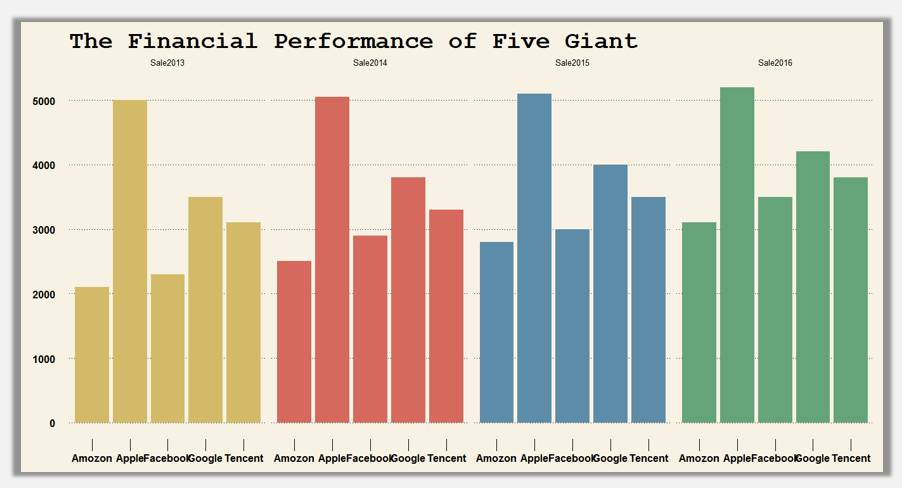
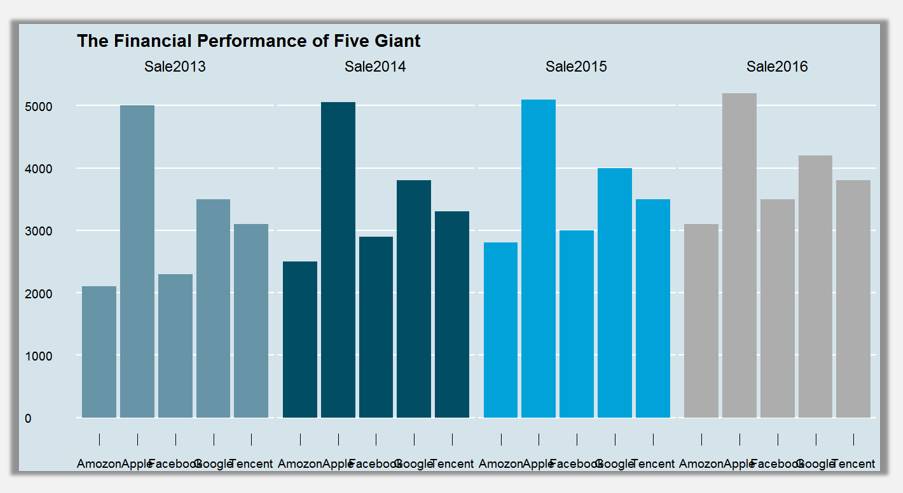
柱形分面(橫排):
ggplot(mydata,aes(Conpany,Sale,fill=Year))+geom_bar(stat="identity",position="dodge")+theme_wsj()+scale_fill_wsj("rgby", "")+theme(axis.ticks.length=unit(0.5,'cm'))+guides(fill=guide_legend(title=NULL))+ggtitle("The Financial Performance of Five Giant")+theme(axis.title = element_blank(),legend.position='none')+ facet_grid(.~Year)
ggplot(mydata,aes(Conpany,Sale,fill=Year))+geom_bar(stat="identity",position="dodge")+theme_economist(base_size=14)+scale_fill_economist()+theme(axis.ticks.length=unit(0.5,'cm'))+guides(fill=guide_legend(title=NULL))+ggtitle("The Financial Performance of Five Giant")+theme(axis.title = element_blank(),legend.position='none')+ facet_grid(.~Year)
條形分面(橫排):
ggplot(mydata,aes(Conpany,Sale,fill=Year))+geom_bar(stat="identity",position="dodge")+theme_wsj()+scale_fill_wsj("rgby", "")+theme(axis.ticks.length=unit(0.5,'cm'))+guides(fill=guide_legend(title=NULL))+ggtitle("The Financial Performance of Five Giant")+theme(axis.title = element_blank(),legend.position='none')+ facet_grid(.~Year)+coord_flip()
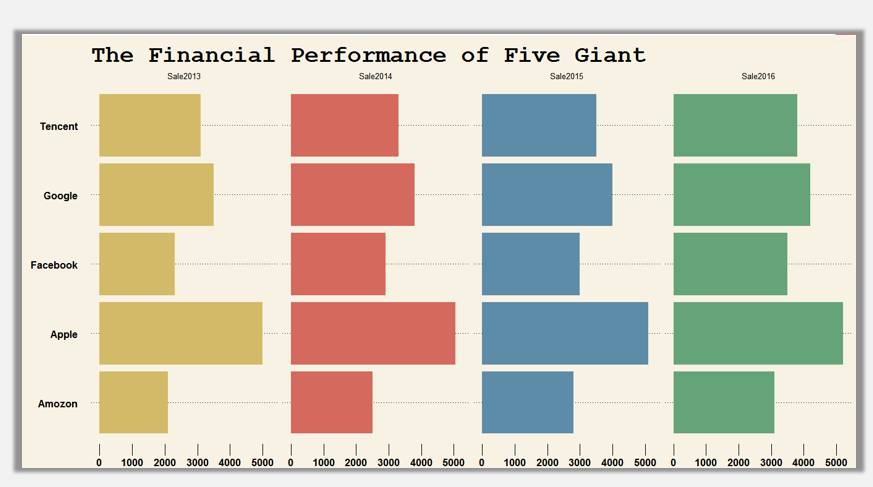
ggplot(mydata,aes(Conpany,Sale,fill=Year))+geom_bar(stat="identity",position="dodge")+theme_economist(base_size=14)+scale_fill_economist()+theme(axis.ticks.length=unit(0.5,'cm'))+guides(fill=guide_legend(title=NULL))+ggtitle("The Financial Performance of Five Giant")+theme(axis.title = element_blank(),legend.position='none')+ facet_grid(.~Year)+coord_flip()
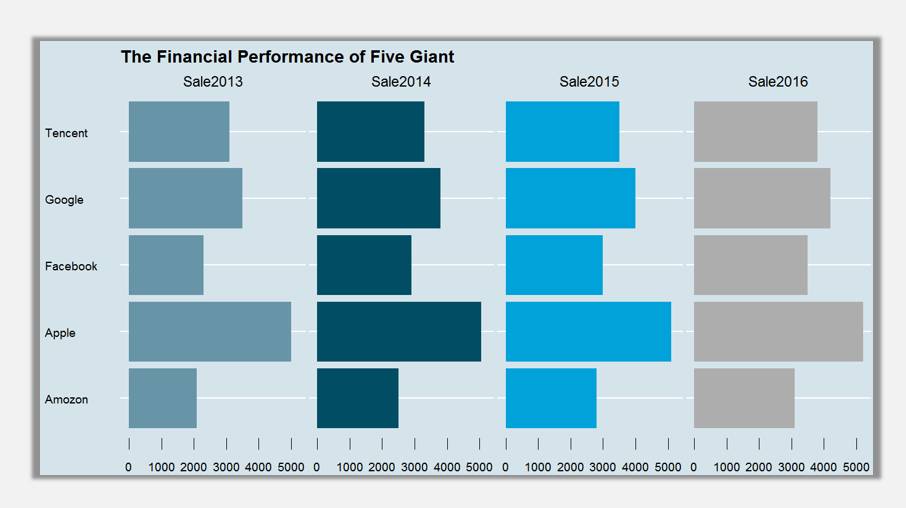
豎排分面:
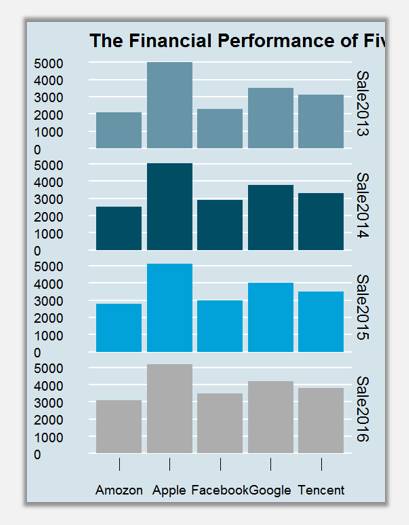
柱形分面(豎排):
ggplot(mydata,aes(Conpany,Sale,fill=Year))+geom_bar(stat="identity",position="dodge")+theme_wsj()+scale_fill_wsj("rgby", "")+theme(axis.ticks.length=unit(0.5,'cm'))+guides(fill=guide_legend(title=NULL))+ggtitle("The Financial Performance of Five Giant")+theme(axis.title = element_blank(),legend.position='none')+ facet_grid(Year~.)
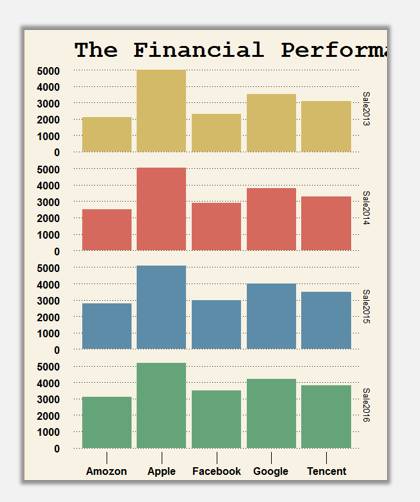
ggplot(mydata,aes(Conpany,Sale,fill=Year))+geom_bar(stat="identity",position="dodge")+theme_economist(base_size=14)+scale_fill_economist()+theme(axis.ticks.length=unit(0.5,'cm'))+guides(fill=guide_legend(title=NULL))+ggtitle("The Financial Performance of Five Giant")+theme(axis.title = element_blank(),legend.position='none')+ facet_grid(Year~.)
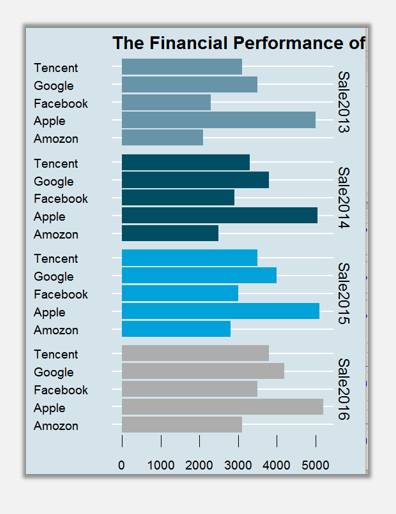
條形分面(豎排):
ggplot(mydata,aes(Conpany,Sale,fill=Year))+geom_bar(stat="identity",position="dodge")+theme_wsj()+scale_fill_wsj("rgby", "")+theme(axis.ticks.length=unit(0.5,'cm'))+guides(fill=guide_legend(title=NULL))+ggtitle("The Financial Performance of Five Giant")+theme(axis.title = element_blank(),legend.position='none')+ facet_grid(Year~.)+coord_flip()
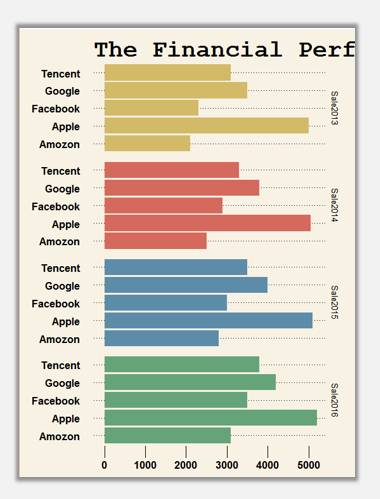
ggplot(mydata,aes(Conpany,Sale,fill=Year))+geom_bar(stat="identity",position="dodge")+theme_economist(base_size=14)+scale_fill_economist()+theme(axis.ticks.length=unit(0.5,'cm'))+guides(fill=guide_legend(title=NULL))+ggtitle("The Financial Performance of Five Giant")+theme(axis.title = element_blank(),legend.position='none')+ facet_grid(Year~.)+coord_flip()
關于簇狀、分面圖表數據標簽問題:
昨天在講解的時候忘記了圖表數據標簽這回事兒,而且當時確實也不太會處理這塊兒,后來突然找到了處理方法:
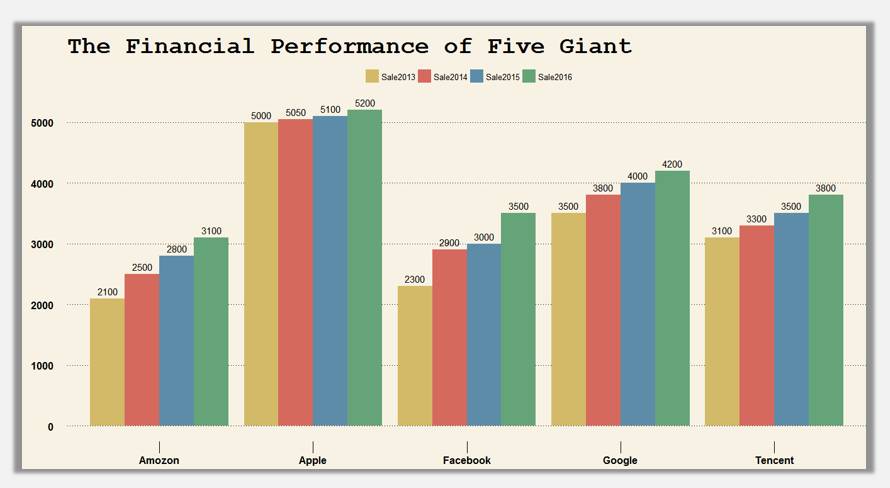
簇狀圖標簽數據處理:
ggplot(mydata,aes(Conpany,Sale,fill=Year,label =Sale))+geom_bar(stat="identity",position="dodge")+theme_wsj()+scale_fill_wsj("rgby", "")+theme(axis.ticks.length=unit(0.5,'cm'))+guides(fill=guide_legend(title=NULL))+ggtitle("The Financial Performance of Five Giant")+theme(axis.title = element_blank())+geom_text(aes(y = Sale + 0.05), position = position_dodge(0.9), vjust = -0.5)
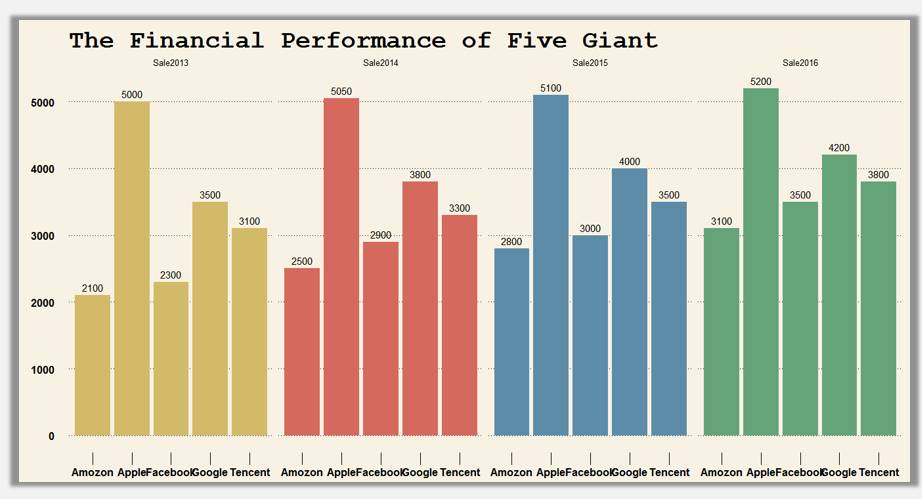
橫向分面柱圖數據標簽問題:
ggplot(mydata,aes(Conpany,Sale,fill=Year,label =Sale))+geom_bar(stat="identity",position="dodge")+theme_wsj()+scale_fill_wsj("rgby", "")+theme(axis.ticks.length=unit(0.5,'cm'))+guides(fill=guide_legend(title=NULL))+ggtitle("The Financial Performance of Five Giant")+theme(axis.title = element_blank(),legend.position='none')+ facet_grid(.~Year)+geom_text(aes(y = Sale + 0.05), position = position_dodge(0.9), vjust = -0.5)
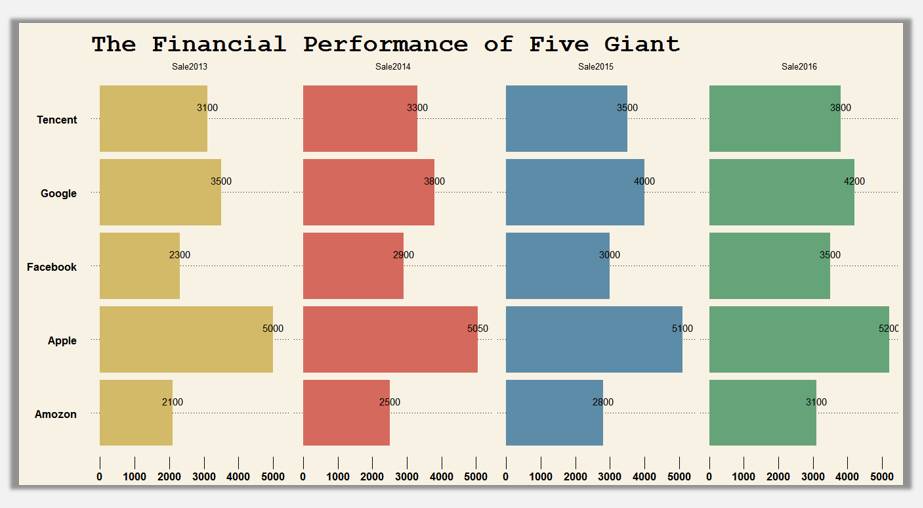
橫向分面條形圖數據標簽問題:
ggplot(mydata,aes(Conpany,Sale,fill=Year,label =Sale))+geom_bar(stat="identity",position="dodge")+theme_wsj()+scale_fill_wsj("rgby", "")+theme(axis.ticks.length=unit(0.5,'cm'))+guides(fill=guide_legend(title=NULL))+ggtitle("The Financial Performance of Five Giant")+theme(axis.title = element_blank(),legend.position='none')+ facet_grid(.~Year)+geom_text(aes(y = Sale + 0.05), position = position_dodge(0.9), vjust = -0.5)+coord_flip()
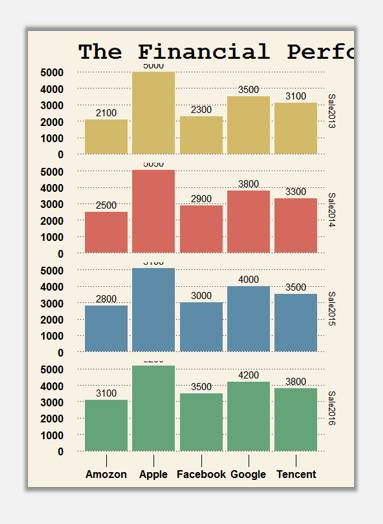
豎向分面柱形圖數據標簽問題:
ggplot(mydata,aes(Conpany,Sale,fill=Year,label =Sale))+geom_bar(stat="identity",position="dodge")+theme_wsj()+scale_fill_wsj("rgby", "")+theme(axis.ticks.length=unit(0.5,'cm'))+guides(fill=guide_legend(title=NULL))+ggtitle("The Financial Performance of Five Giant")+theme(axis.title = element_blank(),legend.position='none')+ facet_grid(Year~.)+geom_text(aes(y = Sale + 0.05), position = position_dodge(0.9), vjust = -0.5)
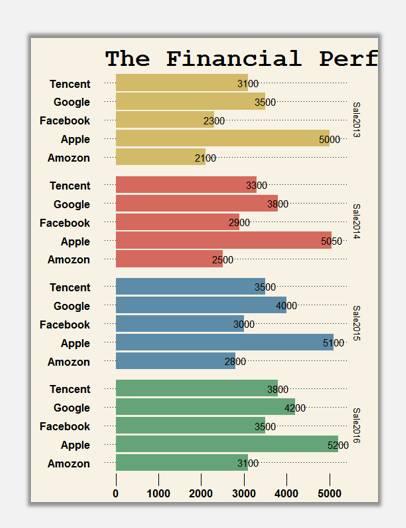
豎向分面條形圖數據標簽問題:
ggplot(mydata,aes(Conpany,Sale,fill=Year,label =Sale))+geom_bar(stat="identity",position="dodge")+theme_wsj()+scale_fill_wsj("rgby", "")+theme(axis.ticks.length=unit(0.5,'cm'))+guides(fill=guide_legend(title=NULL))+ggtitle("The Financial Performance of Five Giant")+theme(axis.title = element_blank(),legend.position='none')+ facet_grid(Year~.)+geom_text(aes(y = Sale + 0.05), position = position_dodge(0.9), vjust = -0.5)+coord_flip()
好了,這樣分面組圖及其標簽問題算是列舉清楚了。
看完上述內容是否對您有幫助呢?如果還想對相關知識有進一步的了解或閱讀更多相關文章,請關注億速云行業資訊頻道,感謝您對億速云的支持。
免責聲明:本站發布的內容(圖片、視頻和文字)以原創、轉載和分享為主,文章觀點不代表本網站立場,如果涉及侵權請聯系站長郵箱:is@yisu.com進行舉報,并提供相關證據,一經查實,將立刻刪除涉嫌侵權內容。