溫馨提示×
您好,登錄后才能下訂單哦!
點擊 登錄注冊 即表示同意《億速云用戶服務條款》
您好,登錄后才能下訂單哦!
總結matplotlib繪圖如何設置坐標軸刻度大小和刻度。
上代碼:
from pylab import *
from matplotlib.ticker import MultipleLocator, FormatStrFormatter
xmajorLocator  = MultipleLocator(20) #將x主刻度標簽設置為20的倍數
xmajorFormatter = FormatStrFormatter('%1.1f') #設置x軸標簽文本的格式
xminorLocator  = MultipleLocator(5) #將x軸次刻度標簽設置為5的倍數
ymajorLocator  = MultipleLocator(0.5) #將y軸主刻度標簽設置為0.5的倍數
ymajorFormatter = FormatStrFormatter('%1.1f') #設置y軸標簽文本的格式
yminorLocator  = MultipleLocator(0.1) #將此y軸次刻度標簽設置為0.1的倍數
t = arange(0.0, 100.0, 1)
s = sin(0.1*pi*t)*exp(-t*0.01)
ax = subplot(111) #注意:一般都在ax中設置,不再plot中設置
plot(t,s,'--b*')
#設置主刻度標簽的位置,標簽文本的格式
ax.xaxis.set_major_locator(xmajorLocator)
ax.xaxis.set_major_formatter(xmajorFormatter)
ax.yaxis.set_major_locator(ymajorLocator)
ax.yaxis.set_major_formatter(ymajorFormatter)
#顯示次刻度標簽的位置,沒有標簽文本
ax.xaxis.set_minor_locator(xminorLocator)
ax.yaxis.set_minor_locator(yminorLocator)
ax.xaxis.grid(True, which='major') #x坐標軸的網格使用主刻度
ax.yaxis.grid(True, which='minor') #y坐標軸的網格使用次刻度

show()
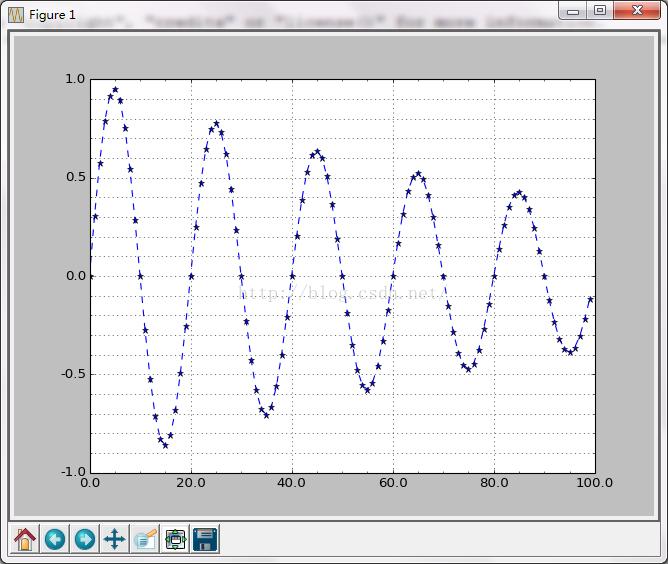
繪圖如下:

如果仔細看代碼,可以得知,設置坐標軸刻度和文本主要使用了"MultipleLocator"、"FormatStrFormatter"方法。
這兩個方法來自matplotlib安裝庫里面ticker.py文件;"MultipleLocator(Locator)"表示將刻度標簽設置為Locator的倍數,"FormatStrFormatter"表示設置標簽文本的格式,代碼中"%1.1f"表示保留小數點后一位,浮點數顯示。
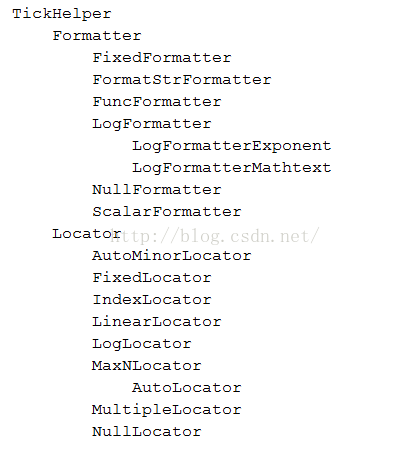
相應的方法還有:

除了以上方法,還有另外一種方法,那就是使用xticks方法(yticks,x,y表示對應坐標軸),xticks用法可在python cmd下輸入以下代碼查看:
import matplotlib.pyplot as plt
help(plt.xticks)
代碼如下:
import numpy as np
import matplotlib.pyplot as plt
fig,ax = plt.subplots()
x = [1,2,3,4,5]
y = [0,2,5,9,15]
#ax is the axes instance
group_labels = ['a', 'b','c','d','e']
plt.plot(x,y)
plt.xticks(x, group_labels, rotation=0)
plt.grid()
plt.show()
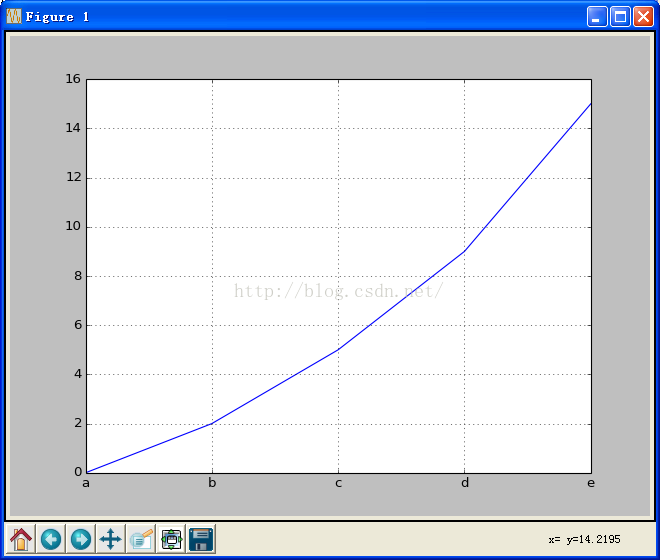
繪圖如下:

上圖中使用了"plt.xticks"方法設置x軸文本,標簽文本使用group_labels中的內容,因此可以根據需要修改group_labels中的內容。
網上看到的另一種方法,代碼如下:
import matplotlib.pyplot as pl
import numpy as np
from matplotlib.ticker import MultipleLocator, FuncFormatter
x = np.arange(0, 4*np.pi, 0.01)
y = np.sin(x)
pl.figure(figsize=(10,6))
pl.plot(x, y,label="$sin(x)$")
ax = pl.gca()

def pi_formatter(x, pos):
  """
  比較羅嗦地將數值轉換為以pi/4為單位的刻度文本
  """
  m = np.round(x / (np.pi/4))
  n = 4
  if m%2==0: m, n = m/2, n/2
  if m%2==0: m, n = m/2, n/2
  if m == 0:
    return "0"
  if m == 1 and n == 1:
    return "$\pi$"
  if n == 1:
    return r"$%d \pi$" % m
  if m == 1:
    return r"$\frac{\pi}{%d}$" % n
  return r"$\frac{%d \pi}{%d}$" % (m,n)

# 設置兩個坐標軸的范圍
pl.ylim(-1.5,1.5)
pl.xlim(0, np.max(x))

# 設置圖的底邊距
pl.subplots_adjust(bottom = 0.15)

pl.grid() #開啟網格

# 主刻度為pi/4
ax.xaxis.set_major_locator( MultipleLocator(np.pi/4) )

# 主刻度文本用pi_formatter函數計算
ax.xaxis.set_major_formatter( FuncFormatter( pi_formatter ) )

# 副刻度為pi/20
ax.xaxis.set_minor_locator( MultipleLocator(np.pi/20) )

# 設置刻度文本的大小
for tick in ax.xaxis.get_major_ticks():
  tick.label1.set_fontsize(16)

pl.legend()
pl.show()
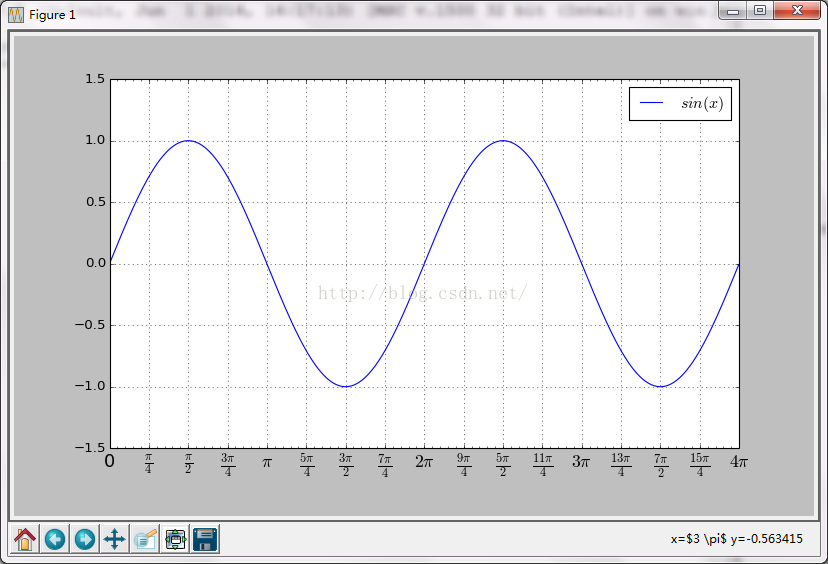
繪圖如下:

以上就是本次小編整理的全部內容,感謝你對億速云的支持。
免責聲明:本站發布的內容(圖片、視頻和文字)以原創、轉載和分享為主,文章觀點不代表本網站立場,如果涉及侵權請聯系站長郵箱:is@yisu.com進行舉報,并提供相關證據,一經查實,將立刻刪除涉嫌侵權內容。