溫馨提示×
您好,登錄后才能下訂單哦!
點擊 登錄注冊 即表示同意《億速云用戶服務條款》
您好,登錄后才能下訂單哦!
學習https://matplotlib.org/gallery/index.html 記錄,描述不一定準確,具體請參考官網
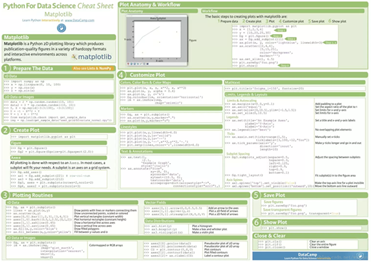
Matplotlib使用總結圖
import matplotlib.pyplot as plt
plt.rcParams['font.sans-serif']=['SimHei'] # 用來正常顯示中文標簽
plt.rcParams['axes.unicode_minus']=False # 用來正常顯示負號

import pandas as pd
import numpy as np
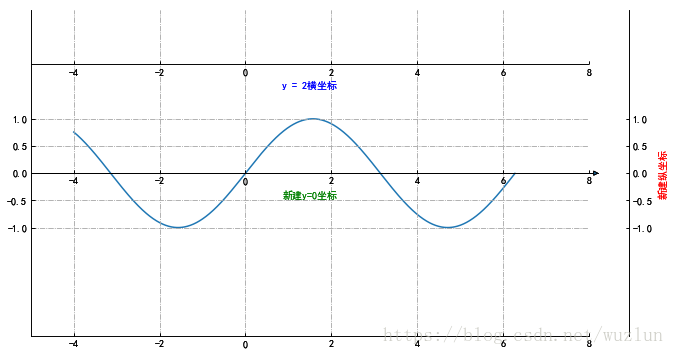
新建隱藏坐標軸
from mpl_toolkits.axisartist.axislines import SubplotZero
import numpy as np

fig = plt.figure(1, (10, 6))

ax = SubplotZero(fig, 1, 1, 1)
fig.add_subplot(ax)

"""新建坐標軸"""
ax.axis["xzero"].set_visible(True)
ax.axis["xzero"].label.set_text("新建y=0坐標")
ax.axis["xzero"].label.set_color('green')
# ax.axis['yzero'].set_visible(True)
# ax.axis["yzero"].label.set_text("新建x=0坐標")

# 新建一條y=2橫坐標軸
ax.axis["新建1"] = ax.new_floating_axis(nth_coord=0, value=2,axis_direction="bottom")
ax.axis["新建1"].toggle(all=True)
ax.axis["新建1"].label.set_text("y = 2橫坐標")
ax.axis["新建1"].label.set_color('blue')

"""坐標箭頭"""
ax.axis["xzero"].set_axisline_style("-|>")

"""隱藏坐標軸"""
# 方法一:隱藏上邊及右邊
# ax.axis["right"].set_visible(False)
# ax.axis["top"].set_visible(False)
#方法二:可以一起寫
ax.axis["top",'right'].set_visible(False)
# 方法三:利用 for in
# for n in ["bottom", "top", "right"]:
#  ax.axis[n].set_visible(False)

"""設置刻度"""
ax.set_ylim(-3, 3)
ax.set_yticks([-1,-0.5,0,0.5,1])
ax.set_xlim([-5, 8])
# ax.set_xticks([-5,5,1])

#設置網格樣式
ax.grid(True, linestyle='-.')


xx = np.arange(-4, 2*np.pi, 0.01)
ax.plot(xx, np.sin(xx))


# 于 offset 處新建一條縱坐標
offset = (40, 0)
new_axisline = ax.get_grid_helper().new_fixed_axis
ax.axis["新建2"] = new_axisline(loc="right", offset=offset, axes=ax)
ax.axis["新建2"].label.set_text("新建縱坐標")
ax.axis["新建2"].label.set_color('red')


plt.show()
# 存為圖像
# fig.savefig('test.png')
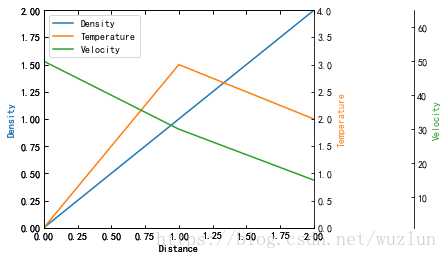
from mpl_toolkits.axes_grid1 import host_subplot
import mpl_toolkits.axisartist as AA
import matplotlib.pyplot as plt

host = host_subplot(111, axes_class=AA.Axes)
plt.subplots_adjust(right=0.75)

par1 = host.twinx()
par2 = host.twinx()

offset = 100
new_fixed_axis = par2.get_grid_helper().new_fixed_axis
par2.axis["right"] = new_fixed_axis(loc="right",
         axes=par2,
         offset=(offset, 0))

par1.axis["right"].toggle(all=True)
par2.axis["right"].toggle(all=True)

host.set_xlim(0, 2)
host.set_ylim(0, 2)

host.set_xlabel("Distance")
host.set_ylabel("Density")
par1.set_ylabel("Temperature")
par2.set_ylabel("Velocity")

p1, = host.plot([0, 1, 2], [0, 1, 2], label="Density")
p2, = par1.plot([0, 1, 2], [0, 3, 2], label="Temperature")
p3, = par2.plot([0, 1, 2], [50, 30, 15], label="Velocity")

par1.set_ylim(0, 4)
par2.set_ylim(1, 65)

host.legend()

host.axis["left"].label.set_color(p1.get_color())
par1.axis["right"].label.set_color(p2.get_color())
par2.axis["right"].label.set_color(p3.get_color())

plt.draw()
plt.show()
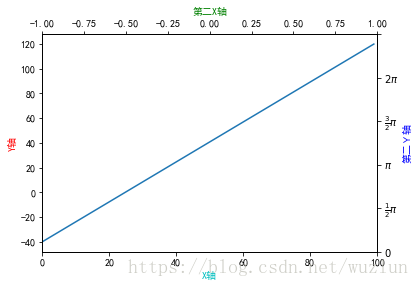
# 第二坐標
fig, ax_f = plt.subplots()
# 這步是關鍵
ax_c = ax_f.twinx()
ax_d = ax_f.twiny()

# automatically update ylim of ax2 when ylim of ax1 changes.
# ax_f.callbacks.connect("ylim_changed", convert_ax_c_to_celsius)
ax_f.plot(np.linspace(-40, 120, 100))
ax_f.set_xlim(0, 100)

# ax_f.set_title('第二坐標', size=14)
ax_f.set_ylabel('Y軸',color='r')
ax_f.set_xlabel('X軸',color='c')

ax_c.set_ylabel('第二Y軸', color='b')
ax_c.set_yticklabels(["$0$", r"$\frac{1}{2}\pi$", r"$\pi$", r"$\frac{3}{2}\pi$", r"$2\pi$"])
# ax_c.set_ylim(1,5)

ax_d.set_xlabel('第二X軸', color='g')
ax_d.set_xlim(-1,1)

plt.show()
刻度及標記
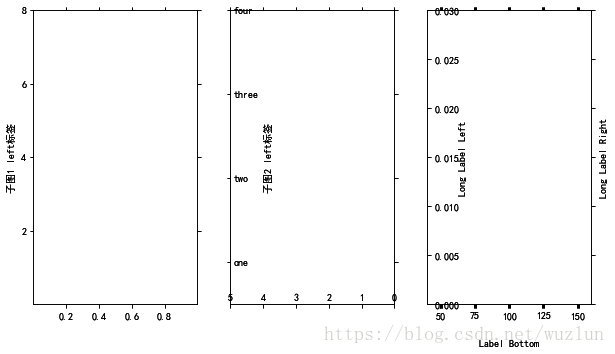
import mpl_toolkits.axisartist.axislines as axislines


fig = plt.figure(1, figsize=(10, 6))
fig.subplots_adjust(bottom=0.2)

# 子圖1
ax1 = axislines.Subplot(fig, 131)
fig.add_subplot(ax1)
# for axis in ax.axis.values():
#  axis.major_ticks.set_tick_out(True) # 標簽全部在外部
ax1.axis[:].major_ticks.set_tick_out(True) # 這句和上面的for循環功能相同
ax1.axis["left"].label.set_text("子圖1 left標簽") # 顯示在左邊
# 設置刻度
ax1.set_yticks([2,4,6,8])
ax1.set_xticks([0.2,0.4,0.6,0.8])

# 子圖2
ax2 = axislines.Subplot(fig, 132)
fig.add_subplot(ax2)
ax2.set_yticks([1,3,5,7])
ax2.set_yticklabels(('one','two','three', 'four', 'five')) # 不顯示‘five'
ax2.set_xlim(5, 0) # X軸刻度
ax2.axis["left"].set_axis_direction("right")
ax2.axis["left"].label.set_text("子圖2 left標簽") # 顯示在右邊
ax2.axis["bottom"].set_axis_direction("top")
ax2.axis["right"].set_axis_direction("left")
ax2.axis["top"].set_axis_direction("bottom")

# 子圖3
ax3 = axislines.Subplot(fig, 133)
fig.add_subplot(ax3)
# 前兩位表示X軸范圍,后兩位表示Y軸范圍
ax3.axis([40, 160, 0, 0.03])
ax3.axis["left"].set_axis_direction("right")
ax3.axis[:].major_ticks.set_tick_out(True)

ax3.axis["left"].label.set_text("Long Label Left")
ax3.axis["bottom"].label.set_text("Label Bottom")
ax3.axis["right"].label.set_text("Long Label Right")
ax3.axis["right"].label.set_visible(True)
ax3.axis["left"].label.set_pad(0)
ax3.axis["bottom"].label.set_pad(20)

plt.show()
import matplotlib.ticker as ticker

# Fixing random state for reproducibility
np.random.seed(19680801)

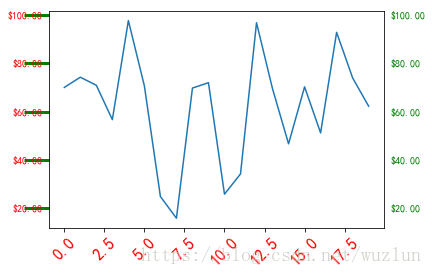
fig, ax = plt.subplots()
ax.plot(100*np.random.rand(20))

# 設置 y坐標軸刻度
formatter = ticker.FormatStrFormatter('$%1.2f')
ax.yaxis.set_major_formatter(formatter)

# 刻度
for tick in ax.yaxis.get_major_ticks():
 tick.label1On = True # label1On 左邊縱坐標
 tick.label2On = True # label2On 右邊縱坐標
 tick.label1.set_color('red')
 tick.label2.set_color('green')

# 刻度線
for line in ax.yaxis.get_ticklines():
 # line is a Line2D instance
 line.set_color('green')
 line.set_markersize(25)
 line.set_markeredgewidth(3)

# 刻度 文字
for label in ax.xaxis.get_ticklabels():
 # label is a Text instance
 label.set_color('red')
 label.set_rotation(45)
 label.set_fontsize(16)

plt.show()
import mpl_toolkits.axisartist as axisartist
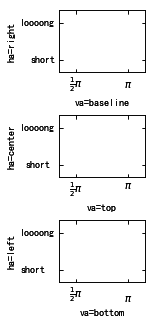
def setup_axes(fig, rect):
 ax = axisartist.Subplot(fig, rect)
 fig.add_subplot(ax)

 ax.set_yticks([0.2, 0.8])
 # 設置刻度標記
 ax.set_yticklabels(["short", "loooong"])
 ax.set_xticks([0.2, 0.8])
 ax.set_xticklabels([r"$\frac{1}{2}\pi$", r"$\pi$"])

 return ax


fig = plt.figure(1, figsize=(3, 5))
fig.subplots_adjust(left=0.5, hspace=0.7)

ax = setup_axes(fig, 311)
ax.set_ylabel("ha=right")
ax.set_xlabel("va=baseline")

ax = setup_axes(fig, 312)
# 刻度標簽對齊方式
ax.axis["left"].major_ticklabels.set_ha("center") # 居中
ax.axis["bottom"].major_ticklabels.set_va("top") # 項部
ax.set_ylabel("ha=center")
ax.set_xlabel("va=top")

ax = setup_axes(fig, 313)
ax.axis["left"].major_ticklabels.set_ha("left")  # 左邊
ax.axis["bottom"].major_ticklabels.set_va("bottom") # 底部
ax.set_ylabel("ha=left")
ax.set_xlabel("va=bottom")

plt.show()
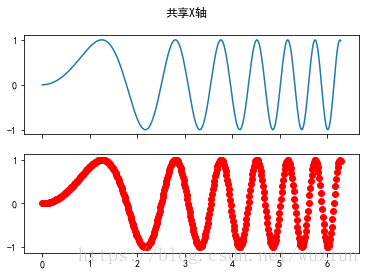
共享坐標軸
# 共享坐標軸 方法一
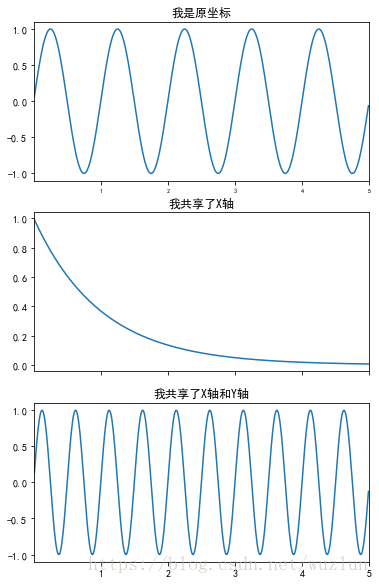
t = np.arange(0.01, 5.0, 0.01)
s1 = np.sin(2 * np.pi * t)
s2 = np.exp(-t)
s3 = np.sin(4 * np.pi * t)

plt.subplots_adjust(top=2) #位置調整

ax1 = plt.subplot(311)
plt.plot(t, s1)
plt.setp(ax1.get_xticklabels(), fontsize=6)
plt.title('我是原坐標')


# 只共享X軸 sharex
ax2 = plt.subplot(312, sharex=ax1)
plt.plot(t, s2)
# make these tick labels invisible
plt.setp(ax2.get_xticklabels(), visible=False)
plt.title('我共享了X軸')


# 共享X軸和Y軸 sharex、sharey
ax3 = plt.subplot(313, sharex=ax1, sharey=ax1)
plt.plot(t, s3)
plt.xlim(0.01, 5.0) #不起作用
plt.title('我共享了X軸和Y軸')
plt.show()
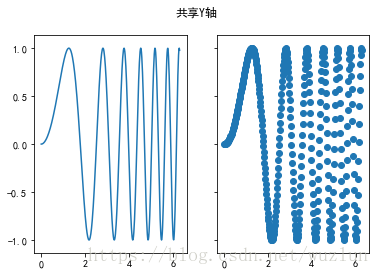
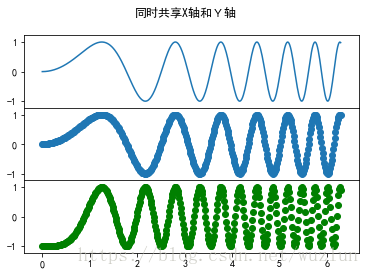
# 共享坐標軸 方法二
x = np.linspace(0, 2 * np.pi, 400)
y = np.sin(x ** 2)

f, axarr = plt.subplots(2, sharex=True)
f.suptitle('共享X軸')
axarr[0].plot(x, y)
axarr[1].scatter(x, y, color='r')

f, (ax1, ax2) = plt.subplots(1, 2, sharey=True)
f.suptitle('共享Y軸')
ax1.plot(x, y)
ax2.scatter(x, y)

f, axarr = plt.subplots(3, sharex=True, sharey=True)
f.suptitle('同時共享X軸和Y軸')
axarr[0].plot(x, y)
axarr[1].scatter(x, y)
axarr[2].scatter(x, 2 * y ** 2 - 1, color='g')
# 間距調整為0
f.subplots_adjust(hspace=0)
# 設置全部標簽在外部
for ax in axarr:
 ax.label_outer()
放大縮小
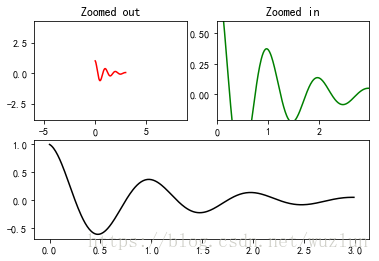
def f(t):
 return np.exp(-t) * np.cos(2*np.pi*t)


t1 = np.arange(0.0, 3.0, 0.01)

ax1 = plt.subplot(212)
ax1.margins(0.05)   # Default margin is 0.05, value 0 means fit
ax1.plot(t1, f(t1), 'k')

ax2 = plt.subplot(221)
ax2.margins(2, 2)   # Values >0.0 zoom out
ax2.plot(t1, f(t1), 'r')
ax2.set_title('Zoomed out')

ax3 = plt.subplot(222)
ax3.margins(x=0, y=-0.25) # Values in (-0.5, 0.0) zooms in to center
ax3.plot(t1, f(t1), 'g')
ax3.set_title('Zoomed in')

plt.show()
from matplotlib.transforms import Bbox, TransformedBbox, \
 blended_transform_factory

from mpl_toolkits.axes_grid1.inset_locator import BboxPatch, BboxConnector,\
 BboxConnectorPatch


def connect_bbox(bbox1, bbox2,
     loc1a, loc2a, loc1b, loc2b,
     prop_lines, prop_patches=None):
 if prop_patches is None:
  prop_patches = prop_lines.copy()
  prop_patches["alpha"] = prop_patches.get("alpha", 1) * 0.2

 c1 = BboxConnector(bbox1, bbox2, loc1=loc1a, loc2=loc2a, **prop_lines)
 c1.set_clip_on(False)
 c2 = BboxConnector(bbox1, bbox2, loc1=loc1b, loc2=loc2b, **prop_lines)
 c2.set_clip_on(False)

 bbox_patch2 = BboxPatch(bbox1, **prop_patches)
 bbox_patch3 = BboxPatch(bbox2, **prop_patches)

 p = BboxConnectorPatch(bbox1, bbox2,
       # loc1a=3, loc2a=2, loc1b=4, loc2b=1,
       loc1a=loc1a, loc2a=loc2a, loc1b=loc1b, loc2b=loc2b,
       **prop_patches)
 p.set_clip_on(False)

 return c1, c2, bbox_patch2, bbox_patch3, p


def zoom_effect01(ax1, ax2, xmin, xmax, **kwargs):
 """
 ax1 : the main axes
 ax1 : the zoomed axes
 (xmin,xmax) : the limits of the colored area in both plot axes.

 connect ax1 & ax2. The x-range of (xmin, xmax) in both axes will
 be marked. The keywords parameters will be used ti create
 patches.

 """

 trans1 = blended_transform_factory(ax1.transData, ax1.transAxes)
 trans2 = blended_transform_factory(ax2.transData, ax2.transAxes)

 bbox = Bbox.from_extents(xmin, 0, xmax, 1)

 mybbox1 = TransformedBbox(bbox, trans1)
 mybbox2 = TransformedBbox(bbox, trans2)

 prop_patches = kwargs.copy()
 prop_patches["ec"] = "none"
 prop_patches["alpha"] = 0.2

 c1, c2, bbox_patch2, bbox_patch3, p = \
  connect_bbox(mybbox1, mybbox2,
      loc1a=3, loc2a=2, loc1b=4, loc2b=1,
      prop_lines=kwargs, prop_patches=prop_patches)

 ax1.add_patch(bbox_patch2)
 ax2.add_patch(bbox_patch3)
 ax2.add_patch(c1)
 ax2.add_patch(c2)
 ax2.add_patch(p)

 return c1, c2, bbox_patch2, bbox_patch3, p


def zoom_effect02(ax1, ax2, **kwargs):
 """
 ax1 : the main axes
 ax1 : the zoomed axes

 Similar to zoom_effect01. The xmin & xmax will be taken from the
 ax1.viewLim.
 """

 tt = ax1.transScale + (ax1.transLimits + ax2.transAxes)
 trans = blended_transform_factory(ax2.transData, tt)

 mybbox1 = ax1.bbox
 mybbox2 = TransformedBbox(ax1.viewLim, trans)

 prop_patches = kwargs.copy()
 prop_patches["ec"] = "none"
 prop_patches["alpha"] = 0.2

 c1, c2, bbox_patch2, bbox_patch3, p = \
  connect_bbox(mybbox1, mybbox2,
      loc1a=3, loc2a=2, loc1b=4, loc2b=1,
      prop_lines=kwargs, prop_patches=prop_patches)

 ax1.add_patch(bbox_patch2)
 ax2.add_patch(bbox_patch3)
 ax2.add_patch(c1)
 ax2.add_patch(c2)
 ax2.add_patch(p)

 return c1, c2, bbox_patch2, bbox_patch3, p


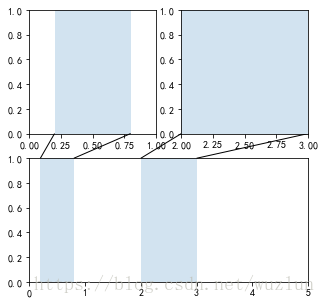
import matplotlib.pyplot as plt

plt.figure(1, figsize=(5, 5))
ax1 = plt.subplot(221)
ax2 = plt.subplot(212)
ax2.set_xlim(0, 1)
ax2.set_xlim(0, 5)
zoom_effect01(ax1, ax2, 0.2, 0.8)


ax1 = plt.subplot(222)
ax1.set_xlim(2, 3)
ax2.set_xlim(0, 5)
zoom_effect02(ax1, ax2)

plt.show()
嵌入式標軸軸
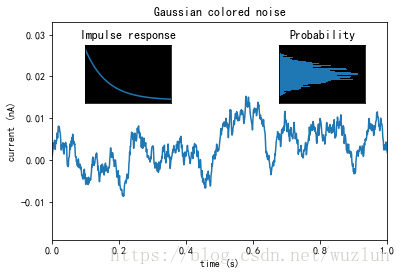
# 相同隨機數
np.random.seed(19680801)


# create some data to use for the plot
dt = 0.001
t = np.arange(0.0, 10.0, dt)
r = np.exp(-t[:1000] / 0.05) # impulse response
x = np.random.randn(len(t))
s = np.convolve(x, r)[:len(x)] * dt # colored noise

# the main axes is subplot(111) by default
plt.plot(t, s)
#坐標軸
plt.axis([0, 1, 1.1 * np.min(s), 2 * np.max(s)])
plt.xlabel('time (s)')
plt.ylabel('current (nA)')
plt.title('Gaussian colored noise')

# this is an inset axes over the main axes
a = plt.axes([.65, .6, .2, .2], facecolor='k')
n, bins, patches = plt.hist(s, 400, density=True, orientation='horizontal')
plt.title('Probability')
plt.xticks([])
plt.yticks([])

# # this is another inset axes over the main axes
a = plt.axes([0.2, 0.6, .2, .2], facecolor='k')
plt.plot(t[:len(r)], r)
plt.title('Impulse response')
plt.xlim(0, 0.2)
plt.xticks([])
plt.yticks([])

plt.show()
非常規坐標軸
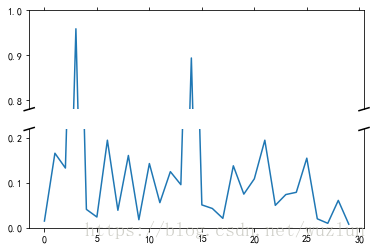
# 30 points between [0, 0.2) originally made using np.random.rand(30)*.2
pts = np.array([
 0.015, 0.166, 0.133, 0.159, 0.041, 0.024, 0.195, 0.039, 0.161, 0.018,
 0.143, 0.056, 0.125, 0.096, 0.094, 0.051, 0.043, 0.021, 0.138, 0.075,
 0.109, 0.195, 0.050, 0.074, 0.079, 0.155, 0.020, 0.010, 0.061, 0.008])

# Now let's make two outlier points which are far away from everything.
pts[[3, 14]] += .8

# If we were to simply plot pts, we'd lose most of the interesting
# details due to the outliers. So let's 'break' or 'cut-out' the y-axis
# into two portions - use the top (ax) for the outliers, and the bottom
# (ax2) for the details of the majority of our data
f, (ax, ax2) = plt.subplots(2, 1, sharex=True)

# plot the same data on both axes
ax.plot(pts)
ax2.plot(pts)

# zoom-in / limit the view to different portions of the data
ax.set_ylim(.78, 1.) # outliers only
ax2.set_ylim(0, .22) # most of the data

# hide the spines between ax and ax2
ax.spines['bottom'].set_visible(False)
ax2.spines['top'].set_visible(False)
ax.xaxis.tick_top()
ax.tick_params(labeltop=False) # don't put tick labels at the top
ax2.xaxis.tick_bottom()

# This looks pretty good, and was fairly painless, but you can get that
# cut-out diagonal lines look with just a bit more work. The important
# thing to know here is that in axes coordinates, which are always
# between 0-1, spine endpoints are at these locations (0,0), (0,1),
# (1,0), and (1,1). Thus, we just need to put the diagonals in the
# appropriate corners of each of our axes, and so long as we use the
# right transform and disable clipping.

d = .015 # how big to make the diagonal lines in axes coordinates
# arguments to pass to plot, just so we don't keep repeating them
kwargs = dict(transform=ax.transAxes, color='k', clip_on=False)
ax.plot((-d, +d), (-d, +d), **kwargs)  # top-left diagonal
ax.plot((1 - d, 1 + d), (-d, +d), **kwargs) # top-right diagonal

kwargs.update(transform=ax2.transAxes) # switch to the bottom axes
ax2.plot((-d, +d), (1 - d, 1 + d), **kwargs) # bottom-left diagonal
ax2.plot((1 - d, 1 + d), (1 - d, 1 + d), **kwargs) # bottom-right diagonal

# What's cool about this is that now if we vary the distance between
# ax and ax2 via f.subplots_adjust(hspace=...) or plt.subplot_tool(),
# the diagonal lines will move accordingly, and stay right at the tips
# of the spines they are 'breaking'

plt.show()
from matplotlib.transforms import Affine2D
import mpl_toolkits.axisartist.floating_axes as floating_axes
import numpy as np
import mpl_toolkits.axisartist.angle_helper as angle_helper
from matplotlib.projections import PolarAxes
from mpl_toolkits.axisartist.grid_finder import (FixedLocator, MaxNLocator,
             DictFormatter)
import matplotlib.pyplot as plt

# Fixing random state for reproducibility
np.random.seed(19680801)


def setup_axes1(fig, rect):
 """
 A simple one.
 """
 tr = Affine2D().scale(2, 1).rotate_deg(30)

 grid_helper = floating_axes.GridHelperCurveLinear(
  tr, extremes=(-0.5, 3.5, 0, 4))

 ax1 = floating_axes.FloatingSubplot(fig, rect, grid_helper=grid_helper)
 fig.add_subplot(ax1)

 aux_ax = ax1.get_aux_axes(tr)

 grid_helper.grid_finder.grid_locator1._nbins = 4
 grid_helper.grid_finder.grid_locator2._nbins = 4

 return ax1, aux_ax


def setup_axes2(fig, rect):
 """
 With custom locator and formatter.
 Note that the extreme values are swapped.
 """
 tr = PolarAxes.PolarTransform()

 pi = np.pi
 angle_ticks = [(0, r"$0$"),
     (.25*pi, r"$\frac{1}{4}\pi$"),
     (.5*pi, r"$\frac{1}{2}\pi$")]
 grid_locator1 = FixedLocator([v for v, s in angle_ticks])
 tick_formatter1 = DictFormatter(dict(angle_ticks))

 grid_locator2 = MaxNLocator(2)

 grid_helper = floating_axes.GridHelperCurveLinear(
  tr, extremes=(.5*pi, 0, 2, 1),
  grid_locator1=grid_locator1,
  grid_locator2=grid_locator2,
  tick_formatter1=tick_formatter1,
  tick_formatter2=None)

 ax1 = floating_axes.FloatingSubplot(fig, rect, grid_helper=grid_helper)
 fig.add_subplot(ax1)

 # create a parasite axes whose transData in RA, cz
 aux_ax = ax1.get_aux_axes(tr)

 aux_ax.patch = ax1.patch # for aux_ax to have a clip path as in ax
 ax1.patch.zorder = 0.9 # but this has a side effect that the patch is
 # drawn twice, and possibly over some other
 # artists. So, we decrease the zorder a bit to
 # prevent this.

 return ax1, aux_ax


def setup_axes3(fig, rect):
 """
 Sometimes, things like axis_direction need to be adjusted.
 """

 # rotate a bit for better orientation
 tr_rotate = Affine2D().translate(-95, 0)

 # scale degree to radians
 tr_scale = Affine2D().scale(np.pi/180., 1.)

 tr = tr_rotate + tr_scale + PolarAxes.PolarTransform()

 grid_locator1 = angle_helper.LocatorHMS(4)
 tick_formatter1 = angle_helper.FormatterHMS()

 grid_locator2 = MaxNLocator(3)

 # Specify theta limits in degrees
 ra0, ra1 = 8.*15, 14.*15
 # Specify radial limits
 cz0, cz1 = 0, 14000
 grid_helper = floating_axes.GridHelperCurveLinear(
  tr, extremes=(ra0, ra1, cz0, cz1),
  grid_locator1=grid_locator1,
  grid_locator2=grid_locator2,
  tick_formatter1=tick_formatter1,
  tick_formatter2=None)

 ax1 = floating_axes.FloatingSubplot(fig, rect, grid_helper=grid_helper)
 fig.add_subplot(ax1)

 # adjust axis
 ax1.axis["left"].set_axis_direction("bottom")
 ax1.axis["right"].set_axis_direction("top")

 ax1.axis["bottom"].set_visible(False)
 ax1.axis["top"].set_axis_direction("bottom")
 ax1.axis["top"].toggle(ticklabels=True, label=True)
 ax1.axis["top"].major_ticklabels.set_axis_direction("top")
 ax1.axis["top"].label.set_axis_direction("top")

 ax1.axis["left"].label.set_text(r"cz [km$^{-1}$]")
 ax1.axis["top"].label.set_text(r"$\alpha_{1950}$")

 # create a parasite axes whose transData in RA, cz
 aux_ax = ax1.get_aux_axes(tr)

 aux_ax.patch = ax1.patch # for aux_ax to have a clip path as in ax
 ax1.patch.zorder = 0.9 # but this has a side effect that the patch is
 # drawn twice, and possibly over some other
 # artists. So, we decrease the zorder a bit to
 # prevent this.

 return ax1, aux_ax


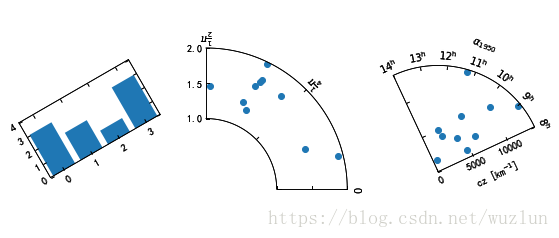
fig = plt.figure(1, figsize=(8, 4))
fig.subplots_adjust(wspace=0.3, left=0.05, right=0.95)

ax1, aux_ax1 = setup_axes1(fig, 131)
aux_ax1.bar([0, 1, 2, 3], [3, 2, 1, 3])

ax2, aux_ax2 = setup_axes2(fig, 132)
theta = np.random.rand(10)*.5*np.pi
radius = np.random.rand(10) + 1.
aux_ax2.scatter(theta, radius)

ax3, aux_ax3 = setup_axes3(fig, 133)

theta = (8 + np.random.rand(10)*(14 - 8))*15. # in degrees
radius = np.random.rand(10)*14000.
aux_ax3.scatter(theta, radius)

plt.show()
import numpy as np
import matplotlib.pyplot as plt
import mpl_toolkits.axisartist.angle_helper as angle_helper
from matplotlib.projections import PolarAxes
from matplotlib.transforms import Affine2D
from mpl_toolkits.axisartist import SubplotHost
from mpl_toolkits.axisartist import GridHelperCurveLinear


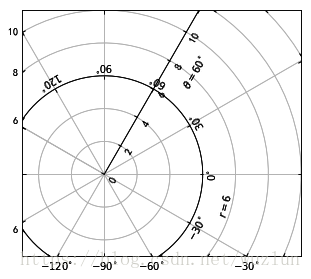
def curvelinear_test2(fig):
 """Polar projection, but in a rectangular box.
 """
 # see demo_curvelinear_grid.py for details
 tr = Affine2D().scale(np.pi / 180., 1.) + PolarAxes.PolarTransform()

 extreme_finder = angle_helper.ExtremeFinderCycle(20,
              20,
              lon_cycle=360,
              lat_cycle=None,
              lon_minmax=None,
              lat_minmax=(0,
                 np.inf),
              )

 grid_locator1 = angle_helper.LocatorDMS(12)

 tick_formatter1 = angle_helper.FormatterDMS()

 grid_helper = GridHelperCurveLinear(tr,
          extreme_finder=extreme_finder,
          grid_locator1=grid_locator1,
          tick_formatter1=tick_formatter1
          )

 ax1 = SubplotHost(fig, 1, 1, 1, grid_helper=grid_helper)

 fig.add_subplot(ax1)

 # Now creates floating axis

 # floating axis whose first coordinate (theta) is fixed at 60
 ax1.axis["lat"] = axis = ax1.new_floating_axis(0, 60)
 axis.label.set_text(r"$\theta = 60^{\circ}$")
 axis.label.set_visible(True)

 # floating axis whose second coordinate (r) is fixed at 6
 ax1.axis["lon"] = axis = ax1.new_floating_axis(1, 6)
 axis.label.set_text(r"$r = 6$")

 ax1.set_aspect(1.)
 ax1.set_xlim(-5, 12)
 ax1.set_ylim(-5, 10)

 ax1.grid(True)

fig = plt.figure(1, figsize=(5, 5))
fig.clf()

curvelinear_test2(fig)

plt.show()
以上就是本文的全部內容,希望對大家的學習有所幫助,也希望大家多多支持億速云。
免責聲明:本站發布的內容(圖片、視頻和文字)以原創、轉載和分享為主,文章觀點不代表本網站立場,如果涉及侵權請聯系站長郵箱:is@yisu.com進行舉報,并提供相關證據,一經查實,將立刻刪除涉嫌侵權內容。