溫馨提示×
您好,登錄后才能下訂單哦!
點擊 登錄注冊 即表示同意《億速云用戶服務條款》
您好,登錄后才能下訂單哦!
本文實例講述了Python使用add_subplot與subplot畫子圖操作。分享給大家供大家參考,具體如下:
子圖:就是在一張figure里面生成多張子圖。
Matplotlib對象簡介
FigureCanvas 畫布
Figure 圖
Axes 坐標軸(實際畫圖的地方)

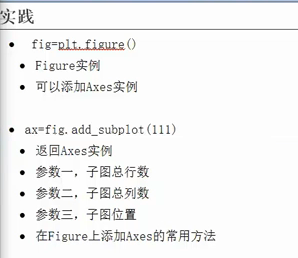
注意,pyplot的方式中plt.subplot()參數和面向對象中的add_subplot()參數和含義都相同。
使用面向對象的方式
#!/usr/bin/python
#coding: utf-8
import numpy as np
import matplotlib.pyplot as plt
x = np.arange(0, 100)
fig = plt.figure()
ax1 = fig.add_subplot(221)
ax1.plot(x, x)
ax2 = fig.add_subplot(222)
ax2.plot(x, -x)
ax3 = fig.add_subplot(223)
ax3.plot(x, x ** 2)
ax4 = fig.add_subplot(224)
ax4.plot(x, np.log(x))
plt.show()
pyplot的方式
#!/usr/bin/python
#coding: utf-8
import numpy as np
import matplotlib.pyplot as plt
x = np.arange(0, 100)
plt.subplot(221)
plt.plot(x, x)
plt.subplot(222)
plt.plot(x, -x)
plt.subplot(223)
plt.plot(x, x ** 2)
plt.subplot(224)
plt.plot(x, np.log(x))
plt.show()
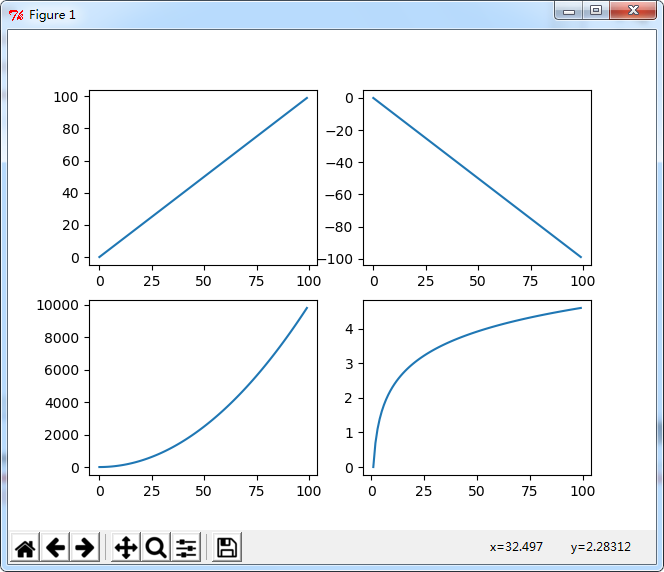
運行結果:

更多關于Python相關內容感興趣的讀者可查看本站專題:《Python數學運算技巧總結》、《Python字符串操作技巧匯總》、《Python編碼操作技巧總結》、《Python數據結構與算法教程》、《Python函數使用技巧總結》、《Python入門與進階經典教程》及《Python文件與目錄操作技巧匯總》
希望本文所述對大家Python程序設計有所幫助。
免責聲明:本站發布的內容(圖片、視頻和文字)以原創、轉載和分享為主,文章觀點不代表本網站立場,如果涉及侵權請聯系站長郵箱:is@yisu.com進行舉報,并提供相關證據,一經查實,將立刻刪除涉嫌侵權內容。