溫馨提示×
您好,登錄后才能下訂單哦!
點擊 登錄注冊 即表示同意《億速云用戶服務條款》
您好,登錄后才能下訂單哦!
今天小編給大家分享一下Python實現計算AUC的方式有哪些的相關知識點,內容詳細,邏輯清晰,相信大部分人都還太了解這方面的知識,所以分享這篇文章給大家參考一下,希望大家閱讀完這篇文章后有所收獲,下面我們一起來了解一下吧。
AUC(Area Under Curve)被定義為ROC曲線下與坐標軸圍成的面積,顯然這個面積的數值不會大于1。又由于ROC曲線一般都處于y=x這條直線的上方,所以AUC的取值范圍在0.5和1之間。AUC越接近1.0,檢測方法真實性越高;等于0.5時,則真實性最低,無應用價值。
import numpy as np
from sklearn.metrics import roc_auc_score
y_true = [1,1,0,0,1,1,0]
y_pred = [0.8,0.7,0.5,0.5,0.5,0.5,0.3]
print(roc_auc_score(y_true, y_pred))
# 下面實現的是方法1
# https://blog.csdn.net/lieyingkub99/article/details/81266664?utm_medium=distribute.pc_relevant.none-task-blog-title-1&spm=1001.2101.3001.4242
def cal_auc1(y_true, y_pred):
    n_bins = 10
    postive_len = sum(y_true)  # M正樣本個數
    negative_len = len(y_true) - postive_len  # N負樣本個數
    total_case = postive_len * negative_len  # M * N樣本對數
    pos_histogram = [0 for _ in range(n_bins)]  # 保存每一個概率值下的正樣本個數
    neg_histogram = [0 for _ in range(n_bins)]  # 保存每一個概率值下的負樣本個數
    bin_width = 1.0 / n_bins
    for i in range(len(y_true)):
        nth_bin = int(y_pred[i] / bin_width)  # 概率值轉化為整數下標
        if y_true[i] == 1:
            pos_histogram[nth_bin] += 1
        else:
            neg_histogram[nth_bin] += 1
    print(pos_histogram)
    print(neg_histogram)
    accumulated_neg = 0
    satisfied_pair = 0
    for i in range(n_bins):
        satisfied_pair += (pos_histogram[i] * accumulated_neg + pos_histogram[i] * neg_histogram[i] * 0.5)
        print(pos_histogram[i], neg_histogram[i], accumulated_neg, satisfied_pair)
        accumulated_neg += neg_histogram[i]

    return satisfied_pair / float(total_case)
print(cal_auc1(y_true, y_pred))
# 下面實現的是方法2
# https://blog.csdn.net/lieyingkub99/article/details/81266664?utm_medium=distribute.pc_relevant.none-task-blog-title-1&spm=1001.2101.3001.4242
def cal_auc2(y_true, y_pred):
    n_bins = 10
    postive_len = sum(y_true)  # M正樣本個數
    negative_len = len(y_true) - postive_len  # N負樣本個數
    total_case = postive_len * negative_len  # M * N樣本對數
    prob_rank = [0 for _ in range(n_bins)]  # 保存每一個概率值的rank
    prob_num = [0 for _ in range(n_bins)]  # 保存每一個概率值出現的次數
    bin_width = 1.0 / n_bins
    raw_arr = []
    for i in range(len(y_true)):
        raw_arr.append([y_pred[i], y_true[i]])
    arr = sorted(raw_arr, key=lambda d: d[0]) # 按概率由低到高排序
    for i in range(len(arr)):
        nth_bin = int(arr[i][0] / bin_width)  # 概率值轉化為整數下標
        prob_rank[nth_bin] = prob_rank[nth_bin] + i + 1
        prob_num[nth_bin] = prob_num[nth_bin] + 1
    satisfied_pair = 0
    for i in range(len(arr)):
        if arr[i][1] == 1:
            nth_bin = int(arr[i][0] / bin_width)  # 概率值轉化為整數下標
            satisfied_pair = satisfied_pair + prob_rank[nth_bin] / prob_num[nth_bin]
    return (satisfied_pair - postive_len * (postive_len + 1) / 2 ) / total_case


print(cal_auc2(y_true, y_pred))

# 根據roc曲線,找不同點算下面積, 需要點足夠多
def cal_auc3(y_true, y_pred):
    """Summary
    Args:
        raw_arr (TYPE): Description
    Returns:
        TYPE: Description
    """
    raw_arr = []
    for i in range(len(y_true)):
        raw_arr.append([y_pred[i], y_true[i]])
    print(raw_arr)
    arr = sorted(raw_arr, key=lambda d:d[0], reverse=True)
    pos, neg = 0., 0.
    for record in arr:
        if record[1] == 1.:
            pos += 1
        else:
            neg += 1

    fp, tp = 0., 0.
    xy_arr = []
    for record in arr:
        if record[1] == 1.:
            tp += 1
        else:
            fp += 1
        xy_arr.append([fp/neg, tp/pos])
    print(xy_arr)
    auc = 0.
    prev_x = 0.
    prev_y = 0.
    for x, y in xy_arr:
        if x != prev_x:
            auc += ((x - prev_x) * (y + prev_y) / 2.)
            prev_x = x
            prev_y = y
        print(auc)
    import numpy as np
    from sklearn.metrics import roc_auc_score
    y_true = [1, 1, 0, 0, 1, 1, 0]
    y_pred = [0.8, 0.7, 0.5, 0.5, 0.5, 0.5, 0.3]
    print(roc_auc_score(y_true, y_pred))
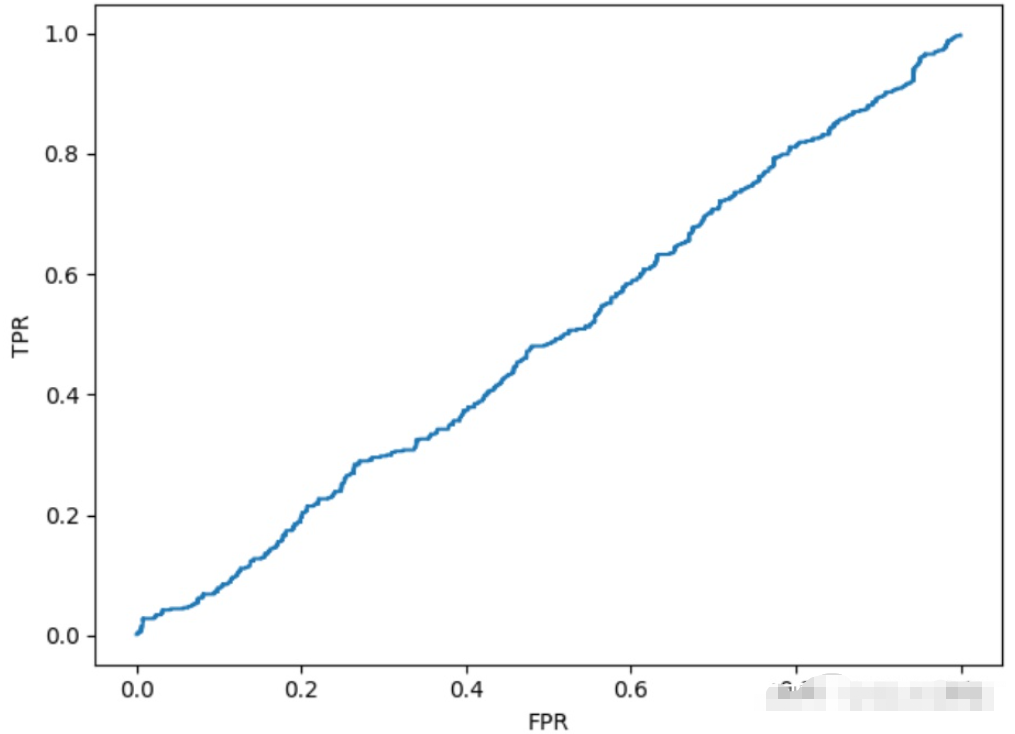
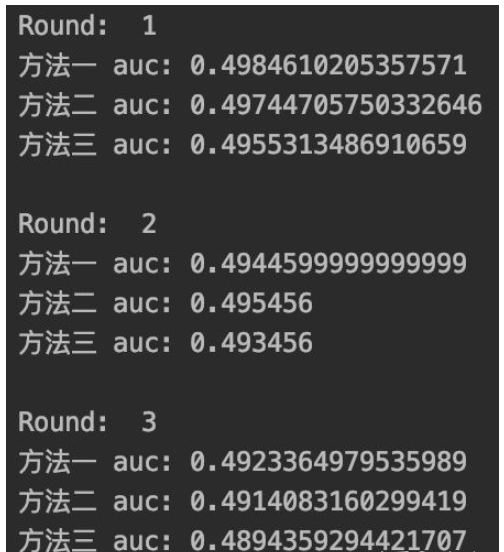
下面是小編為大家找到的另外三個計算AUC的代碼,會輸出三種方法各自的auc,以及通過面積計算AUC時的ROC曲線。
在通過面積計算AUC的方法中,沒有遍歷數據的預測概率作為分類閾值,而是對[0,1]區間等分得到一系列閾值。
# AUC的計算
import numpy as np
import matplotlib.pyplot as plt

for e in range(3):
    print("\nRound: ", e+1)

    num = 1000
    auc1 = auc2 = auc3 = 0.

    # 準備數據
    pred_prob = list(np.random.uniform(low=0,high=1, size=[num]))
    labels = [int(prob>0.5) for prob in list(np.random.uniform(low=0,high=1, size=[num]))]

    # 檢查數據
    # print("pred_prob:\n", pred_prob)
    # print("labels:\n", labels)

    # 方法一,面積加和
    roc_point = []
    for i in range(num):
        i = pred_prob[i]
        TP = 0  # 真陽樣本數
        FP = 0  # 假陽樣本數
        TP_rate = 0.  # 真陽率
        FP_rate = 0.  # 假陽率
        pos_num = 0   # 預測真樣本數

        # 計數過程
        for ind, prob in enumerate(pred_prob):
            if prob>i:
                pos_num += 1
            if prob>i and labels[ind]>0.5:
                TP+=1
            elif prob>i and labels[ind]<0.5:
                FP+=1
        if pos_num!=0:
            TP_rate = TP / sum(labels)
            FP_rate = FP / (num-sum(labels))
        roc_point.append([FP_rate, TP_rate])  # 記錄ROC中的點
    # 畫出ROC曲線
    roc_point.sort(key=lambda x: x[0])
    plt.plot(np.array(roc_point)[1:, 0], np.array(roc_point)[1: ,1])
    plt.xlabel("FPR")
    plt.ylabel("TPR")
    plt.show()

    # 計算每個小長方形的面積,求和即為auc
    lastx = 0.
    for x,y in roc_point:
        auc1 += (x-lastx)*y  # 底乘高
        lastx = x

    print("方法一 auc:", auc1)

    # 方法二,利用AUC關于排列概率的定義計算
    auc2 = 0
    P_ind = []  # 正樣本下標
    F_ind = []  # 負樣本下標
    P_F = 0  # 正樣本分數高于負樣本的數量
    F_P = 0  # 負樣本分數高于正樣本的數量

    #  計數過程
    for ind, val in enumerate(labels):
        if val > 0.5:
            P_ind.append(ind)
        else:
            F_ind.append(ind)
    for Pi in P_ind:
        for Fi in F_ind:
            if pred_prob[Pi] > pred_prob[Fi]:
                P_F += 1
            else:
                F_P += 1
    auc2 = P_F/(len(P_ind)*len(F_ind))
    print("方法二 auc:", auc2)

    # 方法三,方法二的改進,簡化了計算,降低了時間復雜度
    new_data = [[p, l] for p, l in zip(pred_prob, labels)]
    new_data.sort(key=lambda x:x[0])

    # 求正樣本rank之和
    rank_sum = 0
    for ind, [prob,label] in enumerate(new_data):
        if label>0.5:
            rank_sum+=ind
    auc3 = (rank_sum - len(P_ind)*(1+len(P_ind))/2) / (len(P_ind)*len(F_ind))
    print("方法三 auc:", auc3)
運行結果


以上就是“Python實現計算AUC的方式有哪些”這篇文章的所有內容,感謝各位的閱讀!相信大家閱讀完這篇文章都有很大的收獲,小編每天都會為大家更新不同的知識,如果還想學習更多的知識,請關注億速云行業資訊頻道。
免責聲明:本站發布的內容(圖片、視頻和文字)以原創、轉載和分享為主,文章觀點不代表本網站立場,如果涉及侵權請聯系站長郵箱:is@yisu.com進行舉報,并提供相關證據,一經查實,將立刻刪除涉嫌侵權內容。