溫馨提示×
您好,登錄后才能下訂單哦!
點擊 登錄注冊 即表示同意《億速云用戶服務條款》
您好,登錄后才能下訂單哦!
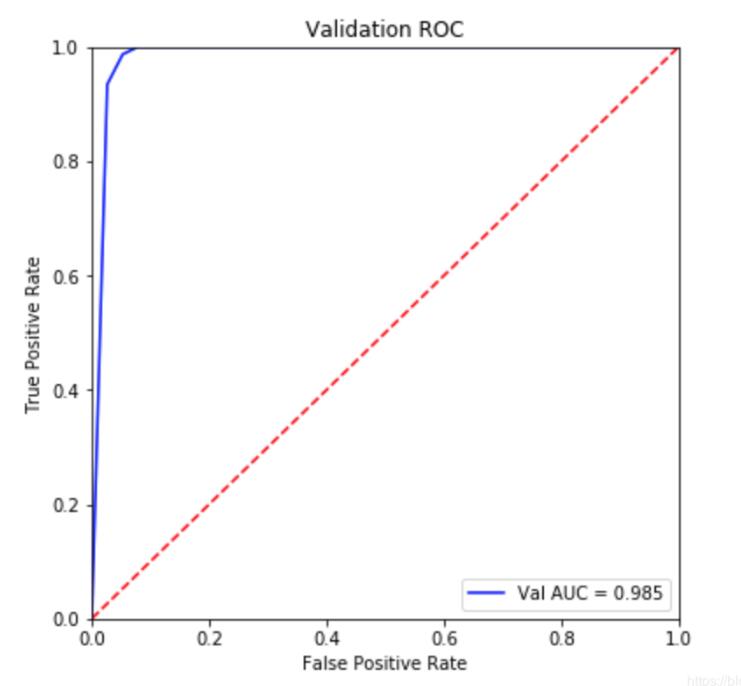
這篇文章將為大家詳細講解有關怎么利用python畫出AUC曲線,小編覺得挺實用的,因此分享給大家做個參考,希望大家閱讀完這篇文章后可以有所收獲。
Python主要應用于:1、Web開發;2、數據科學研究;3、網絡爬蟲;4、嵌入式應用開發;5、游戲開發;6、桌面應用開發。
直接上代碼:
from sklearn.datasets import load_breast_cancer
from sklearn import metrics
from sklearn.ensemble import RandomForestClassifier
from sklearn.model_selection import train_test_split
import pylab as plt
import warnings;warnings.filterwarnings('ignore')
dataset = load_breast_cancer()
data = dataset.data
target = dataset.target
X_train,X_test,y_train,y_test = train_test_split(data,target,test_size=0.2)
rf = RandomForestClassifier(n_estimators=5)
rf.fit(X_train,y_train)
pred = rf.predict_proba(X_test)[:,1]
#############畫圖部分
fpr, tpr, threshold = metrics.roc_curve(y_test, pred)
roc_auc = metrics.auc(fpr, tpr)
plt.figure(figsize=(6,6))
plt.title('Validation ROC')
plt.plot(fpr, tpr, 'b', label = 'Val AUC = %0.3f' % roc_auc)
plt.legend(loc = 'lower right')
plt.plot([0, 1], [0, 1],'r--')
plt.xlim([0, 1])
plt.ylim([0, 1])
plt.ylabel('True Positive Rate')
plt.xlabel('False Positive Rate')
plt.show()
補充拓展:Python機器學習中的roc_auc曲線繪制
廢話不多說,直接上代碼
from sklearn.metrics import roc_curve,auc

from sklearn.ensemble import RandomForestClassifier

import matplotlib.pyplot as plt

from sklearn.model_selection import train_test_split

x_train,y_train,x_test,y_test=train_test_split(x,y,test_size=0.2)

rf=RandomForestClassifier()

rf.fit(x_train,y_train)

rf.score(x_train,y_train)

print('trainscore:'+str(rfbest.score(x_train,y_train)))
print('testscore:'+str(rfbest.score(x_test,y_test)))

y_score=rfbest.fit(x_train,y_train).predict_proba(x_test) #descision_function()不可用

print(type(y_score))

fpr,tpr,threshold=roc_curve(y_test,y_score[:, 1])
roc_auc=auc(fpr,tpr)
plt.figure(figsize=(10,10))
plt.plot(fpr, tpr, color='darkorange',
lw=2, label='ROC curve (area = %0.2f)' % roc_auc) ###假正率為橫坐標,真正率為縱坐標做曲線
plt.plot([0, 1], [0, 1], color='navy', lw=2, linestyle='--')
plt.xlim([0.0, 1.0])
plt.ylim([0.0, 1.05])
plt.xlabel('False Positive Rate')
plt.ylabel('True Positive Rate')
plt.title('Receiver operating characteristic example')
plt.legend(loc="lower right")
plt.show()
關于“怎么利用python畫出AUC曲線”這篇文章就分享到這里了,希望以上內容可以對大家有一定的幫助,使各位可以學到更多知識,如果覺得文章不錯,請把它分享出去讓更多的人看到。
免責聲明:本站發布的內容(圖片、視頻和文字)以原創、轉載和分享為主,文章觀點不代表本網站立場,如果涉及侵權請聯系站長郵箱:is@yisu.com進行舉報,并提供相關證據,一經查實,將立刻刪除涉嫌侵權內容。