溫馨提示×
您好,登錄后才能下訂單哦!
點擊 登錄注冊 即表示同意《億速云用戶服務條款》
您好,登錄后才能下訂單哦!
今天小編給大家分享一下python怎么繪制分組對比柱狀圖的相關知識點,內容詳細,邏輯清晰,相信大部分人都還太了解這方面的知識,所以分享這篇文章給大家參考一下,希望大家閱讀完這篇文章后有所收獲,下面我們一起來了解一下吧。
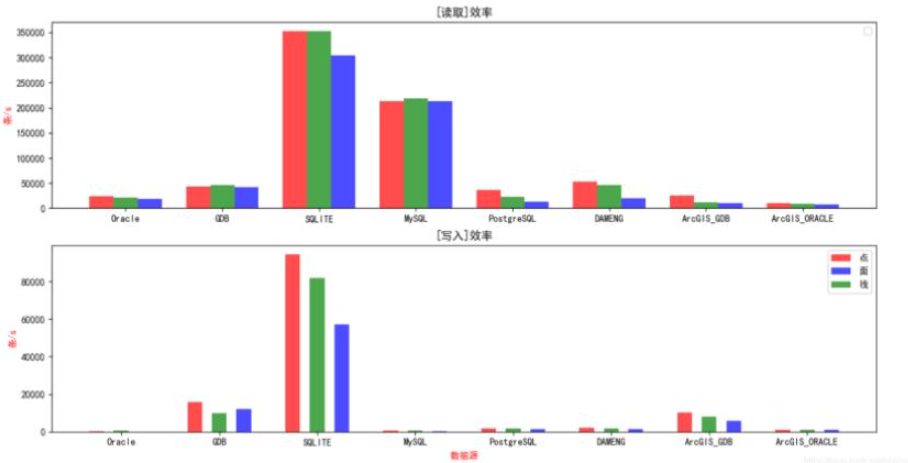
首先放效果圖:

 # -*- coding: utf-8 -*-
import numpy as np

import tensorflow as tf
from matplotlib.path import Path
from matplotlib.patches import PathPatch
import matplotlib.pyplot as plt
import matplotlib
from matplotlib.animation import FuncAnimation
import matplotlib as mpl
import datetime
import time
import  re
import urllib.request
np.set_printoptions(suppress=True)

mpl.rcParams['font.sans-serif'] = ['SimHei'] #指定默認字體 SimHei為黑體
mpl.rcParams['axes.unicode_minus'] = False #用來正常顯示負
import requests
import re
import hashlib

#測試數據  osm的點線面數據
#測試主機 8G 4核 1T機械盤
#mysql 5.7.23
#postgresql 12
#dameng 7
#oracle 19c 19.3


#讀取效率 點             線           面
r = [     [24714,       21748,        19298],     #Oracle
          [44127,       45943,        42199],     #GDB
          #[0,      0,        0],    #SQLITE
         # [0,      0,        0],    #MySQL
          [352641,      352739,        304189],    #SQLITE
          [213550,      218095,        212749],    #MySQL
          [36556,       22172,        12741],     #PostgreSQL
          [52749,       46292,        20040],     #dameng
          [25111,       12000,        11000],     #ArcGIS_GDB
          [10102,       9003,        7003]       #ArcGIS_ORACLE
     ]
 #寫入效率
w = [     [190,         675,        40],        #Oracle
          [15815,       9820,        11892],     #GDB
          [94547,       81847,        57235],     #SQLITE
          # [0,       0,        0],     #SQLITE
         [502,         662,        403],       #MySQL
          #[0,         0,        0],       #MySQL
          [1631,        1599,        1502],      #PostgreSQL
          [2004,        1849,        1524],      #dameng
          [10111,       8000,        5600] ,     #ArcGIS_GDB
          [1100,       1000,        900]        #ArcGIS_ORACLE
    ]
#這是柱圖x軸標簽
ysr = ['Oracle','GDB','SQLITE','MySQL','PostgreSQL','DAMENG','ArcGIS_GDB','ArcGIS_ORACLE']


def DrawGeoDtaabse(rcount, wcount, y):
    #第一行 第一列圖形   2,1 代表2行1列
    ax1 = plt.subplot(2,1,1)
    #第二行 第一列圖形
    ax3 = plt.subplot(2,1,2)
    #默認時間格式
    plt.sca(ax1)
    plt.xlabel("",color = 'r') #X軸標簽
    plt.ylabel("條/s",color = 'r')  #Y軸標簽
    #plt.grid(True)   顯示格網
    #plt.gcf().autofmt_xdate() 顯示時間
    plt.legend() # 顯示圖例
    plt.title("[讀取]效率") #標題

    x1 = [1,5,9,13,17,21,25,29] # x軸點效率位置
    x2 = [i + 1 for i in x1]    # x軸線效率位置
    x3 = [i + 2 for i in x1]    # x軸面效率位置
    y1 = [i[0] for i in rcount] # y軸點效率位置
    y2 = [i[1] for i in rcount] # y軸線效率位置
    y3 = [i[2] for i in rcount] # y軸面效率位置
    #占位以免 數據源標簽丟失
    y0 = ["","","","","","","",""]
    plt.bar(x1, y1, alpha=0.7, width=1, color='r',label="點", tick_label=y0)
    plt.bar(x3, y3, alpha=0.7, width=1, color='b',label="面", tick_label=y0)
    plt.bar(x2, y2, alpha=0.7, width=1, color='g',label="線", tick_label=y)
    #至此第一行的讀取效率繪制完畢,再重復一下第二行的寫效率

    plt.sca(ax3)
    plt.xlabel("數據源",color = 'r') #X軸標簽
    plt.ylabel("條/s",color = 'r') #Y軸標簽
    #plt.grid(True)
    plt.legend() # 顯示圖例
    plt.title("[寫入]效率") #圖標題


    y1 = [i[0] for i in wcount]
    y2 = [i[1] for i in wcount]
    y3 = [i[2] for i in wcount]
    y0 = ["","","","","","","",""]
    plt.bar(x1, y1, alpha=0.7, width=0.6, color='r',label="點", tick_label=y0)
    plt.bar(x3, y3, alpha=0.7, width=0.6, color='b',label="面", tick_label=y0)
    plt.bar(x2, y2, alpha=0.7, width=0.6, color='g',label="線", tick_label=y)

    plt.legend()
    plt.show()

DrawGeoDtaabse(r,w,ysr)
以上就是“python怎么繪制分組對比柱狀圖”這篇文章的所有內容,感謝各位的閱讀!相信大家閱讀完這篇文章都有很大的收獲,小編每天都會為大家更新不同的知識,如果還想學習更多的知識,請關注億速云行業資訊頻道。
免責聲明:本站發布的內容(圖片、視頻和文字)以原創、轉載和分享為主,文章觀點不代表本網站立場,如果涉及侵權請聯系站長郵箱:is@yisu.com進行舉報,并提供相關證據,一經查實,將立刻刪除涉嫌侵權內容。