您好,登錄后才能下訂單哦!
您好,登錄后才能下訂單哦!
這篇文章主要為大家展示了“怎么利用Python快速繪制海報級別地圖”,內容簡而易懂,條理清晰,希望能夠幫助大家解決疑惑,下面讓小編帶領大家一起研究并學習一下“怎么利用Python快速繪制海報級別地圖”這篇文章吧。
基于Python中諸如matplotlib等功能豐富、自由度極高的繪圖庫,我們可以完成各種極富藝術感的可視化作品,關于這一點我在系列文章在模仿中精進數據可視化中已經帶大家學習過很多案例了。
而今天我要給大家介紹的這個Python庫prettymaps非常的有趣,基于它,我們只需要簡單的代碼就可以對地球上給定坐標和范圍的任意地區進行地圖可視化?。
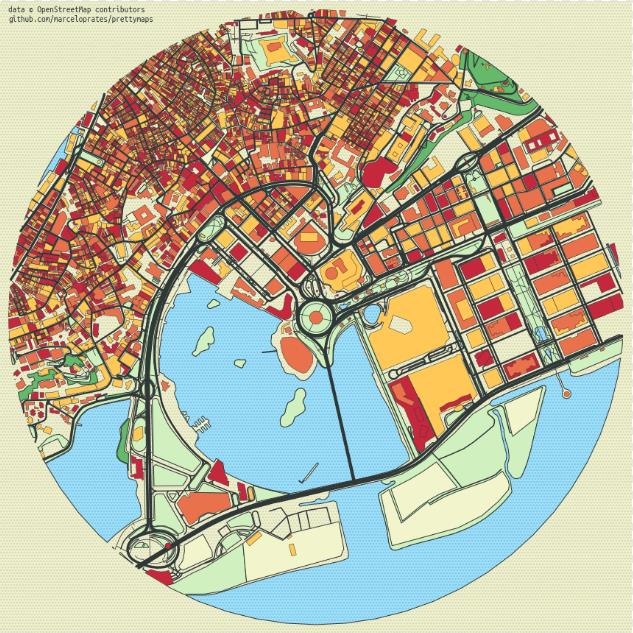
遺憾的是,prettymaps暫時還不能通過pip或conda直接進行安裝,但可以利用pip配合git從源碼倉庫進行安裝,對于國內的用戶來說,可以使用下面的語句從github的鏡像地址快速安裝:
pip install git+https://hub.fastgit.org/marceloprates/prettymaps.git
安裝完成后,如果下面的語句執行無誤,那么恭喜你已經安裝完成:
from prettymaps import *
prettymaps無需用戶自行準備數據,會根據用戶設定的坐標和范圍大小來自動從OpenStreetMap上獲取相應范圍內的矢量數據作為繪圖素材,主要有以下幾種使用方式:
prettymaps中最簡單的繪圖模式為圓形模式,我們只需要傳入中心點經緯度坐標,以及半徑范圍(單位:米)即可,下面的例子來自官方示例程序,我將其地點換成以上海外灘為中心向外2500米范圍:
from prettymaps import *
from matplotlib import pyplot as plt

# 創建圖床
fig, ax = plt.subplots(figsize = (12, 12), constrained_layout = True)

layers = plot(
    (31.23346, 121.492154), # 圓心坐標,格式:(緯度, 經度)
    radius = 2500, # 半徑
    ax = ax, # 綁定圖床
    layers = {
        'perimeter': {}, # 控制繪圖模式,{}即相當于圓形繪圖模式
        # 下面的參數用于定義從OsmStreetMap選擇獲取的矢量圖層要素,不了解的無需改動照搬即可
        'streets': {
            'custom_filter': '["highway"~"motorway|trunk|primary|secondary|tertiary|residential|service|unclassified|pedestrian|footway"]',
            'width': {
                'motorway': 5,
                'trunk': 5,
                'primary': 4.5,
                'secondary': 4,
                'tertiary': 3.5,
                'residential': 3,
                'service': 2,
                'unclassified': 2,
                'pedestrian': 2,
                'footway': 1,
            }
        },
        'building': {'tags': {'building': True, 'landuse': 'construction'}, 'union': False},
        'water': {'tags': {'natural': ['water', 'bay']}},
        'green': {'tags': {'landuse': 'grass', 'natural': ['island', 'wood'], 'leisure': 'park'}},
        'forest': {'tags': {'landuse': 'forest'}},
        'parking': {'tags': {'amenity': 'parking', 'highway': 'pedestrian', 'man_made': 'pier'}}
    },
    # 下面的參數用于定義OpenStreetMap中不同矢量圖層的樣式,嫌麻煩的直接照抄下面的官方示例即可
    drawing_kwargs = {
        'background': {'fc': '#F2F4CB', 'ec': '#dadbc1', 'hatch': 'ooo...', 'zorder': -1},
        'perimeter': {'fc': '#F2F4CB', 'ec': '#dadbc1', 'lw': 0, 'hatch': 'ooo...',  'zorder': 0},
        'green': {'fc': '#D0F1BF', 'ec': '#2F3737', 'lw': 1, 'zorder': 1},
        'forest': {'fc': '#64B96A', 'ec': '#2F3737', 'lw': 1, 'zorder': 1},
        'water': {'fc': '#a1e3ff', 'ec': '#2F3737', 'hatch': 'ooo...', 'hatch_c': '#85c9e6', 'lw': 1, 'zorder': 2},
        'parking': {'fc': '#F2F4CB', 'ec': '#2F3737', 'lw': 1, 'zorder': 3},
        'streets': {'fc': '#2F3737', 'ec': '#475657', 'alpha': 1, 'lw': 0, 'zorder': 3},
        'building': {'palette': ['#FFC857', '#E9724C', '#C5283D'], 'ec': '#2F3737', 'lw': .5, 'zorder': 4},
    },

    osm_credit = {'color': '#2F3737'}
)

# 導出圖片文件
plt.savefig('上海外灘-圓形模式.png', dpi=500)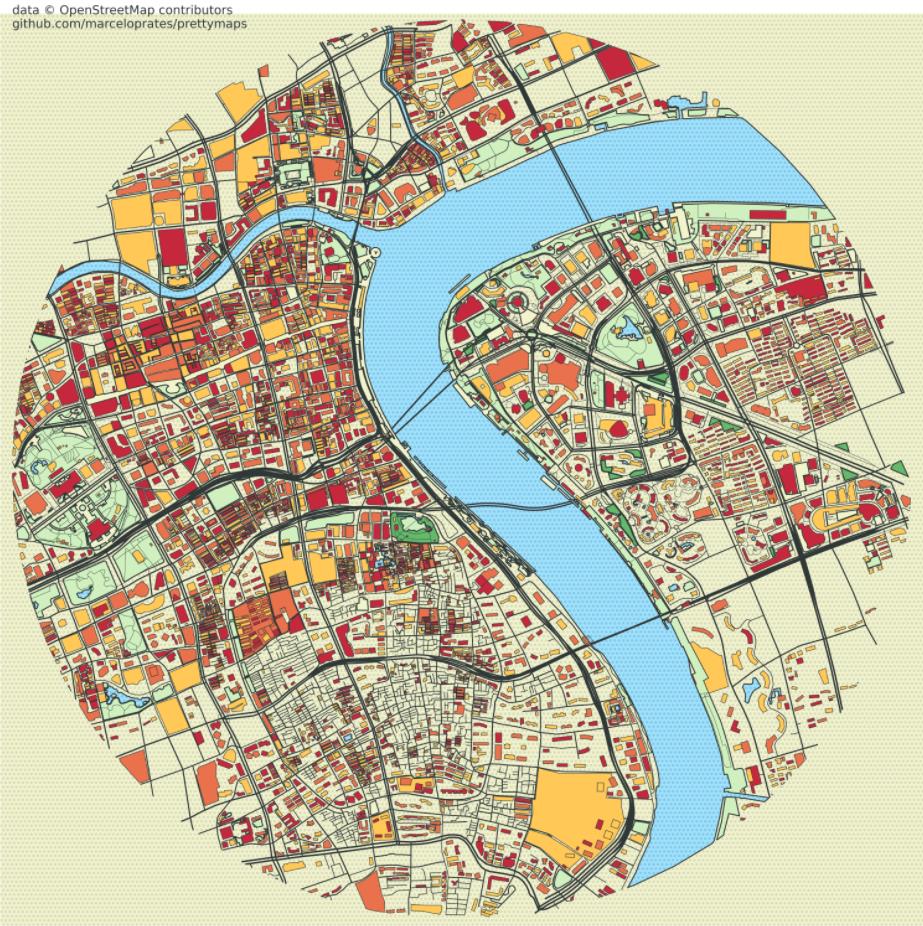
除了上述的圓形模式之外,prettymaps中還可以使用圓角矩形模式,同樣需要定義中心點坐標和半徑,接著為參數layers下的每個鍵值對添加鍵值對{'circle': False, 'dilate': 圓角半徑}即可,其中圓角半徑為數值型,這次我們換一個地方,以故宮為例,半徑選擇600米:
# 創建圖床
fig, ax = plt.subplots(figsize = (12, 12), constrained_layout = True)

dilate = 100

layers = plot(
    (39.91645697864148, 116.39077532493388), # 圓心坐標,格式:(緯度, 經度)
    radius = 600, # 半徑
    ax = ax, # 綁定圖床
    layers = {
        'perimeter': {'circle': False, 'dilate': dilate}, # 控制繪圖模式,{}即相當于圓形繪圖模式
        # 下面的參數用于定義從OsmStreetMap選擇獲取的矢量圖層要素,不了解的無需改動照搬即可
        'streets': {
            'custom_filter': '["highway"~"motorway|trunk|primary|secondary|tertiary|residential|service|unclassified|pedestrian|footway"]',
            'width': {
                'motorway': 5,
                'trunk': 5,
                'primary': 4.5,
                'secondary': 4,
                'tertiary': 3.5,
                'residential': 3,
                'service': 2,
                'unclassified': 2,
                'pedestrian': 2,
                'footway': 1,
            },
            'circle': False, 'dilate': dilate
        },
        'building': {'tags': {'building': True, 'landuse': 'construction'}, 'union': False, 'circle': False, 'dilate': dilate},
        'water': {'tags': {'natural': ['water', 'bay']}, 'circle': False, 'dilate': dilate},
        'green': {'tags': {'landuse': 'grass', 'natural': ['island', 'wood'], 'leisure': 'park'}, 'circle': False, 'dilate': dilate},
        'forest': {'tags': {'landuse': 'forest'}, 'circle': False, 'dilate': dilate},
        'parking': {'tags': {'amenity': 'parking', 'highway': 'pedestrian', 'man_made': 'pier'}, 'circle': False, 'dilate': dilate}
    },
    # 下面的參數用于定義OpenStreetMap中不同矢量圖層的樣式,嫌麻煩的直接照抄下面的官方示例即可
    drawing_kwargs = {
        'background': {'fc': '#F2F4CB', 'ec': '#dadbc1', 'hatch': 'ooo...', 'zorder': -1},
        'perimeter': {'fc': '#F2F4CB', 'ec': '#dadbc1', 'lw': 0, 'hatch': 'ooo...',  'zorder': 0},
        'green': {'fc': '#D0F1BF', 'ec': '#2F3737', 'lw': 1, 'zorder': 1},
        'forest': {'fc': '#64B96A', 'ec': '#2F3737', 'lw': 1, 'zorder': 1},
        'water': {'fc': '#a1e3ff', 'ec': '#2F3737', 'hatch': 'ooo...', 'hatch_c': '#85c9e6', 'lw': 1, 'zorder': 2},
        'parking': {'fc': '#F2F4CB', 'ec': '#2F3737', 'lw': 1, 'zorder': 3},
        'streets': {'fc': '#2F3737', 'ec': '#475657', 'alpha': 1, 'lw': 0, 'zorder': 3},
        'building': {'palette': ['#FFC857', '#E9724C', '#C5283D'], 'ec': '#2F3737', 'lw': .5, 'zorder': 4},
    },

    osm_credit = {'color': '#2F3737'}
)

# 導出圖片文件
plt.savefig('北京故宮-圓角矩形模式.png', dpi=500)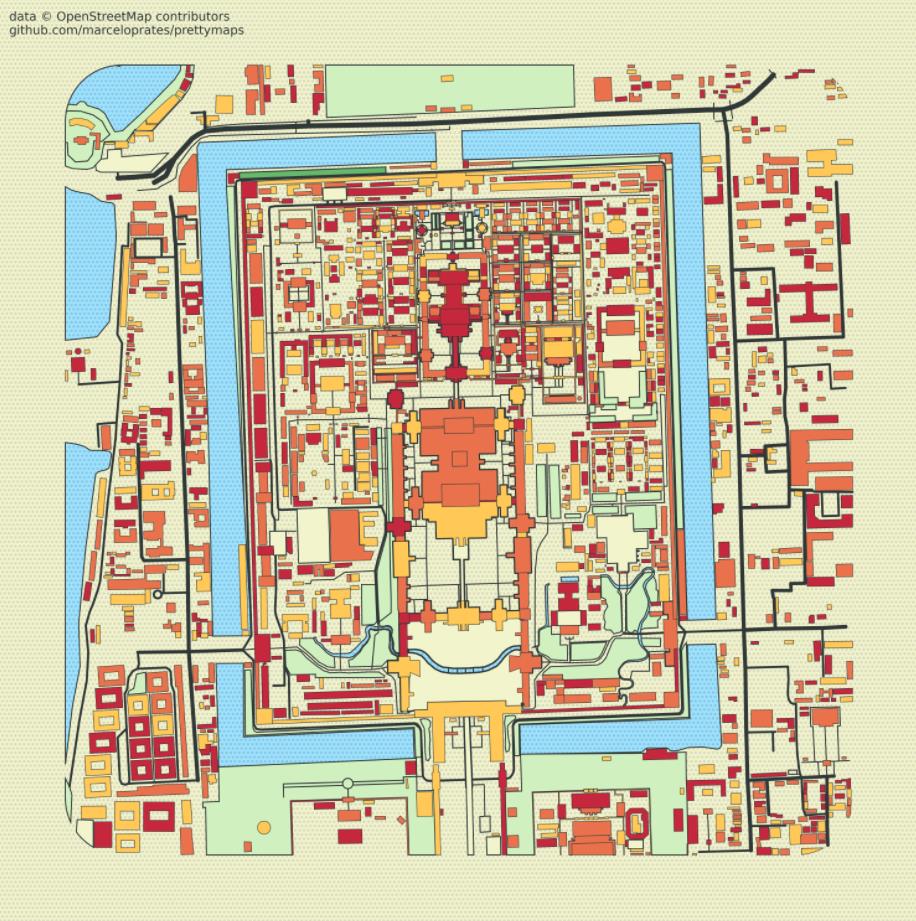
有了這樣美觀大方的藝術地圖,我們還可以基于matplotlib中自定義字體的方法,在地圖上添加標注信息,仍然以上海外灘為例,我們利用外部的書法字體,在正中心繪制文字標注信息:
import matplotlib.font_manager as fm

# 創建圖床
fig, ax = plt.subplots(figsize = (12, 12), constrained_layout = True)

layers = plot(
    (31.23346, 121.492154), # 圓心坐標,格式:(緯度, 經度)
    radius = 2500, # 半徑
    ax = ax, # 綁定圖床
    layers = {
        'perimeter': {}, # 控制繪圖模式,{}即相當于圓形繪圖模式
        # 下面的參數用于定義從OsmStreetMap選擇獲取的矢量圖層要素,不了解的無需改動照搬即可
        'streets': {
            'custom_filter': '["highway"~"motorway|trunk|primary|secondary|tertiary|residential|service|unclassified|pedestrian|footway"]',
            'width': {
                'motorway': 5,
                'trunk': 5,
                'primary': 4.5,
                'secondary': 4,
                'tertiary': 3.5,
                'residential': 3,
                'service': 2,
                'unclassified': 2,
                'pedestrian': 2,
                'footway': 1,
            }
        },
        'building': {'tags': {'building': True, 'landuse': 'construction'}, 'union': False},
        'water': {'tags': {'natural': ['water', 'bay']}},
        'green': {'tags': {'landuse': 'grass', 'natural': ['island', 'wood'], 'leisure': 'park'}},
        'forest': {'tags': {'landuse': 'forest'}},
        'parking': {'tags': {'amenity': 'parking', 'highway': 'pedestrian', 'man_made': 'pier'}}
    },
    # 下面的參數用于定義OpenStreetMap中不同矢量圖層的樣式,嫌麻煩的直接照抄下面的官方示例即可
    drawing_kwargs = {
        'background': {'fc': '#F2F4CB', 'ec': '#dadbc1', 'hatch': 'ooo...', 'zorder': -1},
        'perimeter': {'fc': '#F2F4CB', 'ec': '#dadbc1', 'lw': 0, 'hatch': 'ooo...',  'zorder': 0},
        'green': {'fc': '#D0F1BF', 'ec': '#2F3737', 'lw': 1, 'zorder': 1},
        'forest': {'fc': '#64B96A', 'ec': '#2F3737', 'lw': 1, 'zorder': 1},
        'water': {'fc': '#a1e3ff', 'ec': '#2F3737', 'hatch': 'ooo...', 'hatch_c': '#85c9e6', 'lw': 1, 'zorder': 2},
        'parking': {'fc': '#F2F4CB', 'ec': '#2F3737', 'lw': 1, 'zorder': 3},
        'streets': {'fc': '#2F3737', 'ec': '#475657', 'alpha': 1, 'lw': 0, 'zorder': 3},
        'building': {'palette': ['#FFC857', '#E9724C', '#C5283D'], 'ec': '#2F3737', 'lw': .5, 'zorder': 4},
    },

    osm_credit = {'color': '#2F373700'}
)

# 添加文字標注
ax.text(
    0.5, 0.5,
    '外灘, 上海',
    zorder = 6,
    ha='center',
    va='center',
    fontsize=120,
    fontproperties = fm.FontProperties(fname='FZZJ-HLYHXSJW.TTF'),
    transform=ax.transAxes
)

# 導出圖片文件
plt.savefig('上海外灘-添加文字標注.png', dpi=500)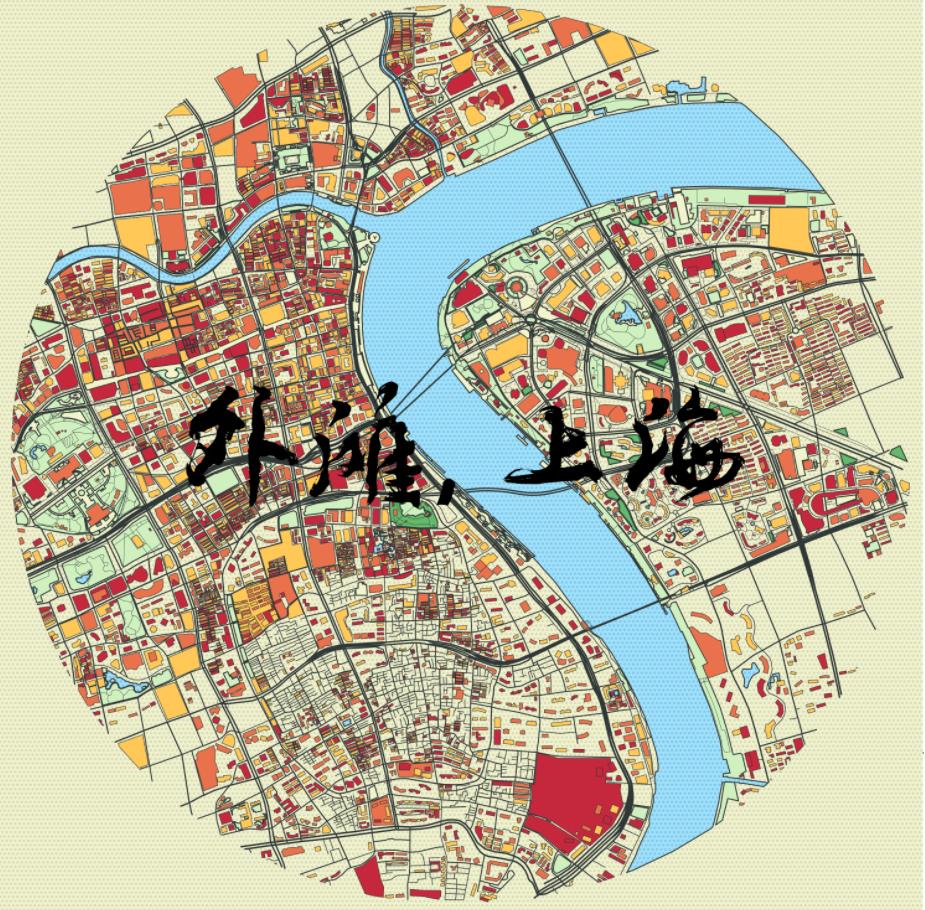
你可以找到你關注地點的經緯度坐標,盡情地繪制出各種藝術地圖作品,譬如下面這些地標:
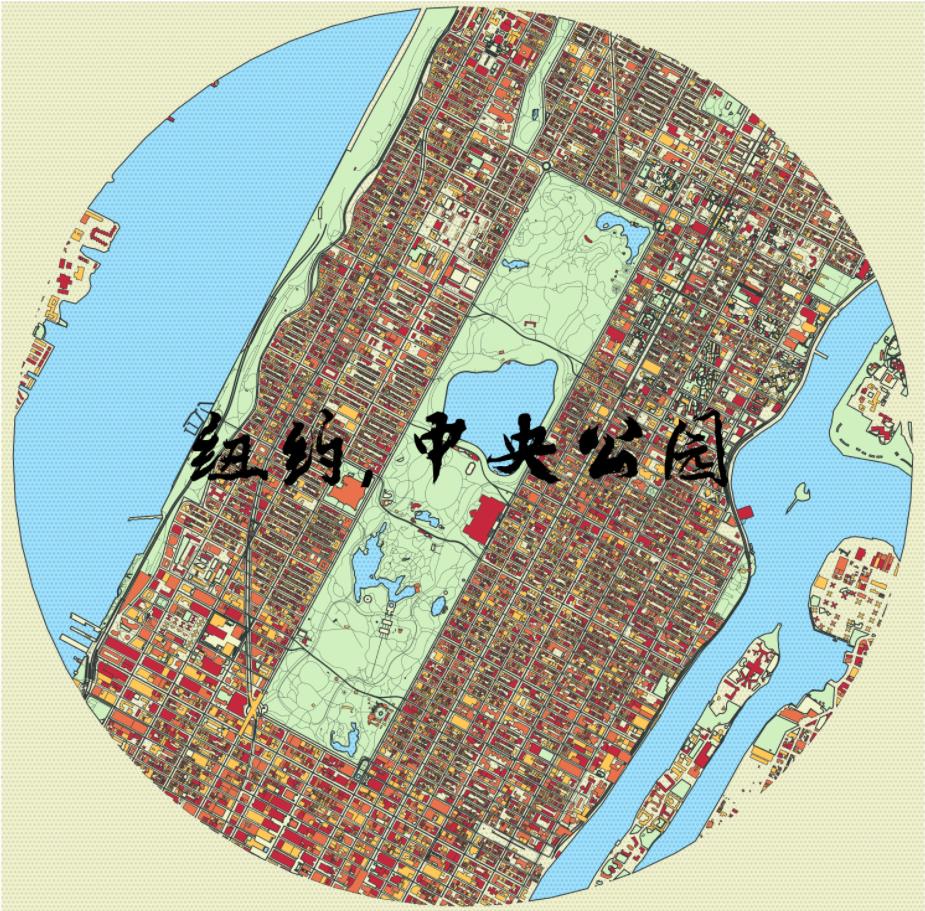
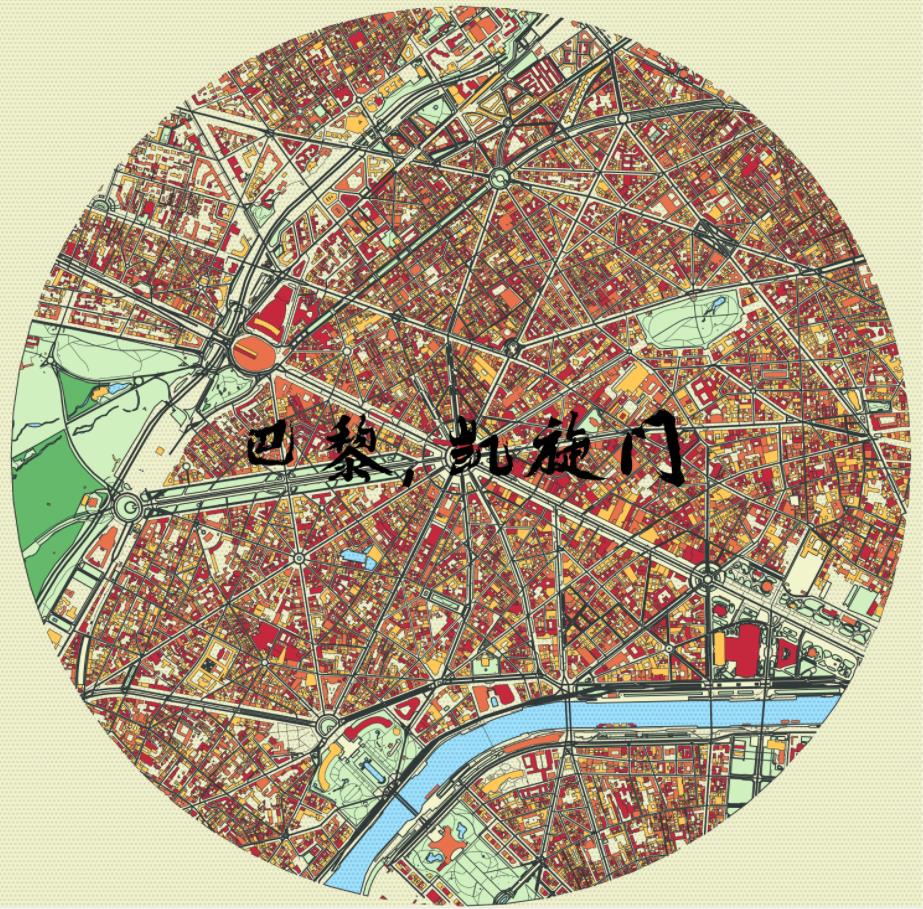
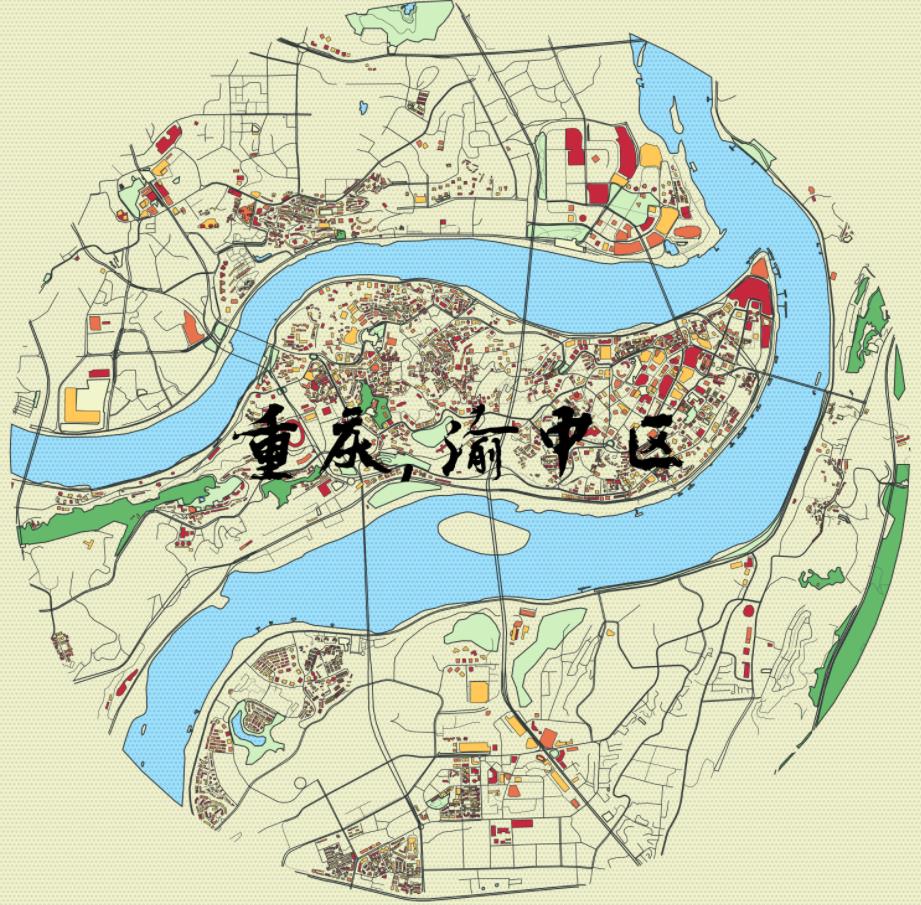
以上是“怎么利用Python快速繪制海報級別地圖”這篇文章的所有內容,感謝各位的閱讀!相信大家都有了一定的了解,希望分享的內容對大家有所幫助,如果還想學習更多知識,歡迎關注億速云行業資訊頻道!
免責聲明:本站發布的內容(圖片、視頻和文字)以原創、轉載和分享為主,文章觀點不代表本網站立場,如果涉及侵權請聯系站長郵箱:is@yisu.com進行舉報,并提供相關證據,一經查實,將立刻刪除涉嫌侵權內容。