您好,登錄后才能下訂單哦!
您好,登錄后才能下訂單哦!
這篇文章主要介紹了R語言如何實現T檢驗,具有一定借鑒價值,感興趣的朋友可以參考下,希望大家閱讀完這篇文章之后大有收獲,下面讓小編帶著大家一起了解一下。
T檢驗是用來檢驗兩組數據之間均值是否有差異的一種方法,比如下面我們用到的數據包括20個男生和20個女生的體重數據。
試驗設計是自然群體下(人們正常生活,沒有可以控制自己的體重)探究
于是在理想的群體中隨機抽取20個男生和20個女生測量體重,記錄數據。
這時候的統計檢驗方法就可以選擇T檢驗。
示例數據集來自datarium包的genderweight加載數據data('genderweight',package='datarium')查看數據前六行head(genderweight)數據集是一個數據框,將男生和女生的數據拆分成兩個向量
library(dplyr)
women_weight <- genderweight %>%
  filter(group == "F") %>%
  pull(weight)
women_weight
men_weight <- genderweight %>%
  filter(group == "M") %>%
  pull(weight)
men_weight
這里我新學到的函數是pull(),作用是用管道符把數據傳遞給他然后指定列名就直接轉換成向量了。
如果要檢驗均值是否相等
t.test(women_weight,men_weight)
輸出結果是
 Welch Two Sample t-test

data:  women_weight and men_weight
t = -20.791, df = 26.872, p-value < 2.2e-16
alternative hypothesis: true difference in means is not equal to 0
95 percent confidence interval:
 -24.53135 -20.12353
sample estimates:
mean of x mean of y
 63.49867  85.82612
t檢驗的零假設是兩組數據均值相等,結果中p-value小于0.05,拒絕原假設,接受備擇假設alternative hypothesis,備擇假設是true difference in means is not equal to 0,翻譯過來就是平均值差異不等于0,就是均值有差異。 這個做的是Welch Two Sample t-test,如果要做學生式T檢驗,可以在t.test()函數里加var.equal=T參數
> t.test(women_weight,men_weight,var.equal=T)

 Two Sample t-test

data:  women_weight and men_weight
t = -20.791, df = 38, p-value < 2.2e-16
alternative hypothesis: true difference in means is not equal to 0
95 percent confidence interval:
 -24.50140 -20.15349
sample estimates:
mean of x mean of y
 63.49867  85.82612
如果要看男生體重是否比女生大,需要加alternative參數
t.test(men_weight,women_weight,var.equal=T,alternative = "greater")
男生的數據放第一個參數,女生的數據方第二個參數,alternative = "greater"是指備擇假設是男生體重大于女生,對應的零假設就是男生體重不大于女生。 結果
 Two Sample t-test

data:  men_weight and women_weight
t = 20.791, df = 38, p-value < 2.2e-16
alternative hypothesis: true difference in means is greater than 0
95 percent confidence interval:
 20.51693      Inf
sample estimates:
mean of x mean of y
 85.82612  63.49867
p-value小于0.05拒絕原假設,所以結論就是男生體重大于女生
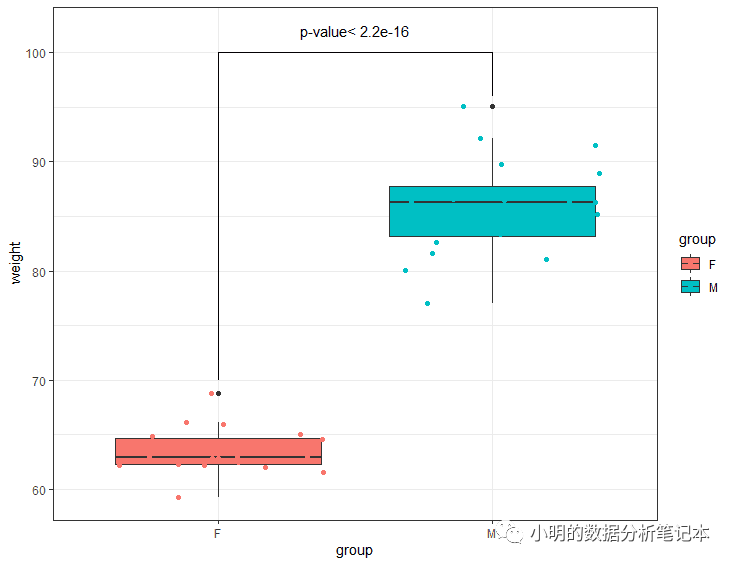
接下來是結果展示,T檢驗的結果通常可以用箱線圖來展示
library(ggplot2)
ggplot(genderweight,aes(x=group,y=weight))+
  geom_boxplot(aes(fill=group))+
  geom_jitter(aes(color=group))+
  geom_segment(aes(x=1,xend=1,y=70,yend=100))+
  geom_segment(aes(x=2,xend=2,y=96,yend=100))+
  geom_segment(aes(x=1,xend=2,y=100,yend=100))+
  annotate('text',x=1.5,y=102,label="p-value< 2.2e-16")+
  theme_bw()

感謝你能夠認真閱讀完這篇文章,希望小編分享的“R語言如何實現T檢驗”這篇文章對大家有幫助,同時也希望大家多多支持億速云,關注億速云行業資訊頻道,更多相關知識等著你來學習!
免責聲明:本站發布的內容(圖片、視頻和文字)以原創、轉載和分享為主,文章觀點不代表本網站立場,如果涉及侵權請聯系站長郵箱:is@yisu.com進行舉報,并提供相關證據,一經查實,將立刻刪除涉嫌侵權內容。