溫馨提示×
您好,登錄后才能下訂單哦!
點擊 登錄注冊 即表示同意《億速云用戶服務條款》
您好,登錄后才能下訂單哦!
今天就跟大家聊聊有關Matplotlib中怎么利用子圖繪制數據,可能很多人都不太了解,為了讓大家更加了解,小編給大家總結了以下內容,希望大家根據這篇文章可以有所收獲。
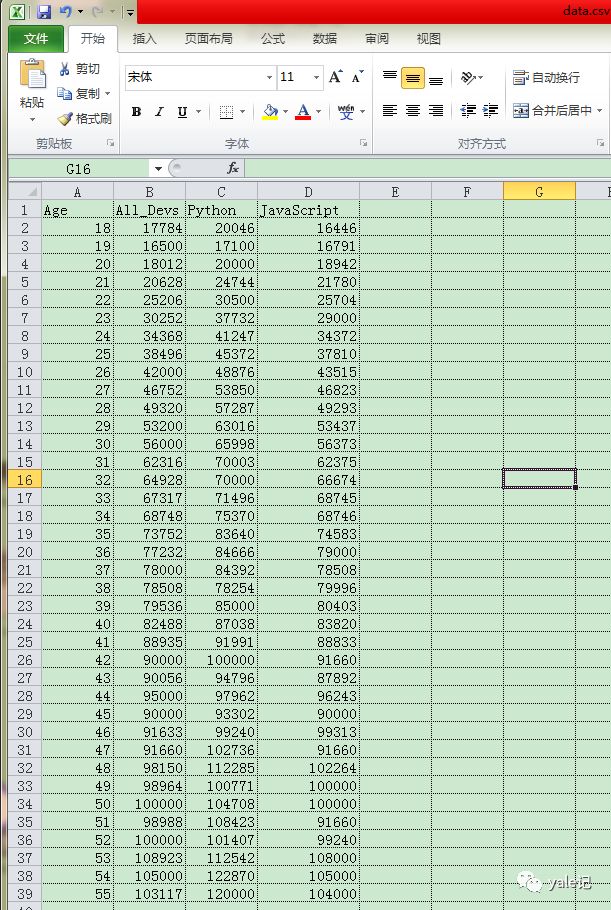
首先我們從data.csv文件中讀取數據,進行繪制:

接下來看代碼實現:
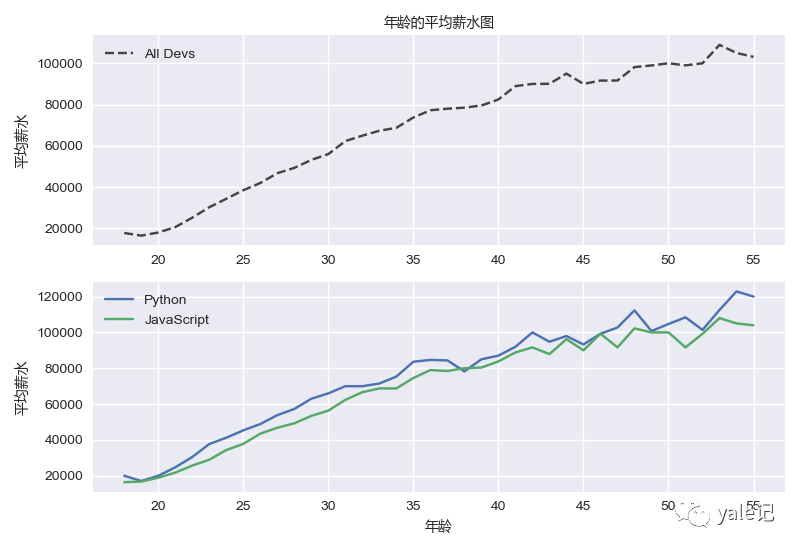
import pandas as pdfrom matplotlib import pyplot as pltfrom matplotlib import font_managerplt.style.use('seaborn')data = pd.read_csv('data.csv')ages = data['Age']dev_salaries = data['All_Devs']py_salaries = data['Python']js_salaries = data['JavaScript']#創建子圖fig, (ax1,ax2) = plt.subplots(nrows=2,ncols=1)ax1.plot(ages, dev_salaries, color='#444444',linestyle='--', label='All Devs')ax2.plot(ages, py_salaries, label='Python')ax2.plot(ages, js_salaries, label='JavaScript')zh_font = font_manager.\FontProperties(fname='C:\\Windows\\Fonts\\msyh.ttf')ax1.legend()ax1.set_title('年齡的平均薪水圖',fontproperties=zh_font)ax1.set_ylabel('平均薪水',fontproperties=zh_font)ax2.legend()ax2.set_xlabel('年齡',fontproperties=zh_font)ax2.set_ylabel('平均薪水',fontproperties=zh_font)plt.tight_layout()plt.show()#保存圖表為圖片fig.savefig('fig.png')運行結果:

看完上述內容,你們對Matplotlib中怎么利用子圖繪制數據有進一步的了解嗎?如果還想了解更多知識或者相關內容,請關注億速云行業資訊頻道,感謝大家的支持。
免責聲明:本站發布的內容(圖片、視頻和文字)以原創、轉載和分享為主,文章觀點不代表本網站立場,如果涉及侵權請聯系站長郵箱:is@yisu.com進行舉報,并提供相關證據,一經查實,將立刻刪除涉嫌侵權內容。