您好,登錄后才能下訂單哦!
您好,登錄后才能下訂單哦!
這篇文章給大家分享的是有關如何利用R語言的ggplot2包繪制GO富集柱形圖的內容。小編覺得挺實用的,因此分享給大家做個參考,一起跟隨小編過來看看吧。
一 載入數據集和R包
利用各種生信工具得到富集分析結果,數據列可能不一致,但關鍵幾列都有。
library(ggplot2)data <- read.csv("GO_enrichment_significant.csv",header=TRUE)head(data)

二 對上述GO結果繪制基礎bar圖
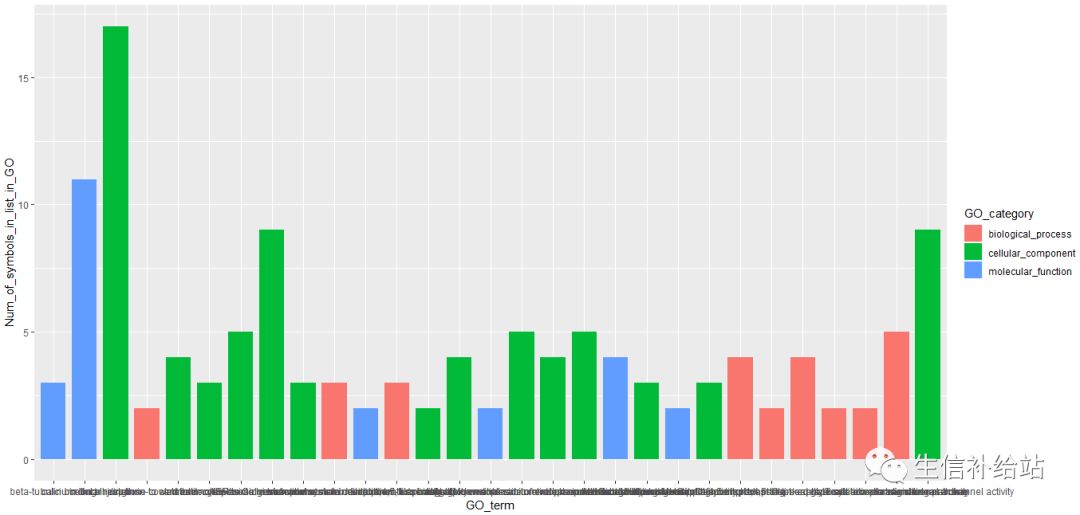
參照之前ggplot2使用方法,更改geom即可繪制簡單的bar圖,按照GO_category分組顏色
ggplot(data=data, aes(x=GO_term,y=Num_of_symbols_in_list_in_GO, fill=GO_category)) + geom_bar(stat="identity", width=0.8)

可看出和文獻中的差距較大,體現在以下幾個方面:
A:標題,坐標軸“業余”;
B:GO_category順序未按照輸入文件,相同GO_category沒在一起;
C:橫坐標label太長,重疊在一起。
三 “細節”調整GO結果bar圖
3.1 坐標軸調整策略
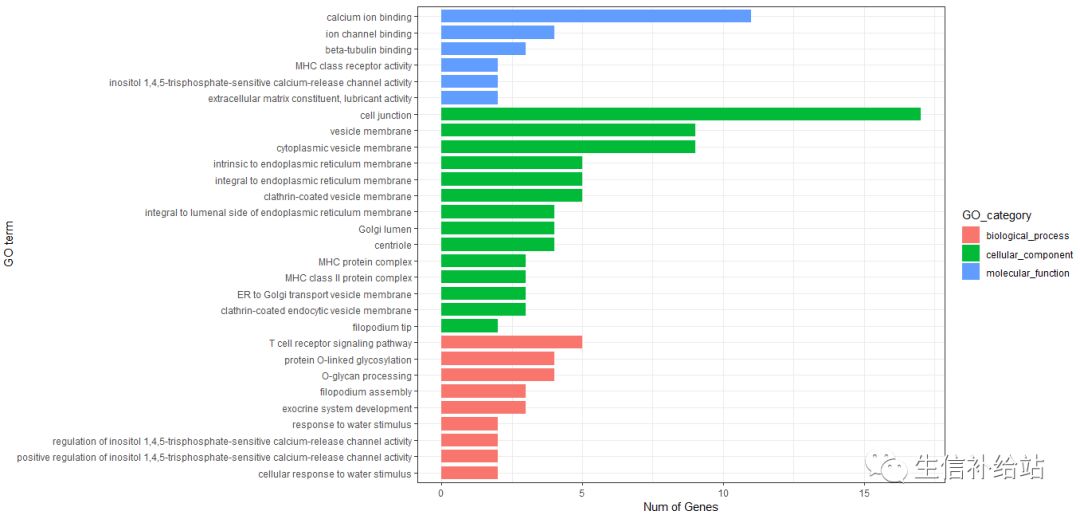
#將GO_term設定為factor即可按照順序輸出GO_term_order=factor(as.integer(rownames(data)),labels=data$GO_term)ggplot(data=data, aes(x=GO_term_order,y=Num_of_symbols_in_list_in_GO, fill=GO_category)) + geom_bar(stat="identity", width=0.8) + coord_flip() + xlab("GO term") + ylab("Num of Genes") + theme_bw()

好像有一點能看了,嘗試其他策略。
3.2 調整橫坐標label策略
將label調整成一定角度傾斜
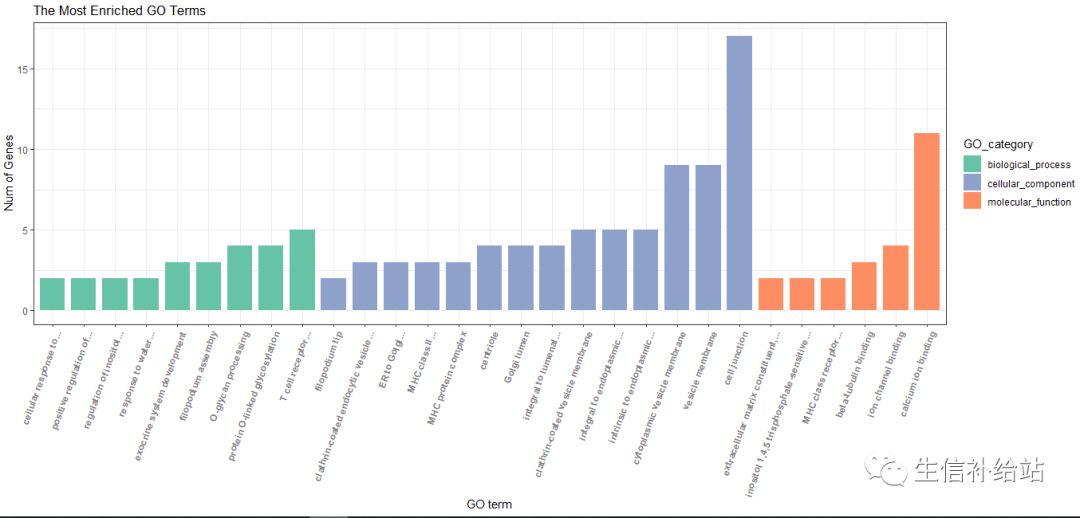
COLS <- c("#66C3A5", "#8DA1CB", "#FD8D62")ggplot(data=data, aes(x=GO_term_order,y=Num_of_symbols_in_list_in_GO, fill=GO_category)) + geom_bar(stat="identity", width=0.8) + scale_fill_manual(values = COLS) + theme_bw() + xlab("GO term") + ylab("Num of Genes") + labs(title = "The Most Enriched GO Terms")+ theme(axis.text.x=element_text(face = "bold", color="gray50",angle = 70,vjust = 1, hjust = 1 ))

嗯 ,標簽太長溢出,采取保留GO-term的前三個單詞(可以其他策略)后面...代替,可以excel或者R function 解決。
3.3 調整label長度后繪圖
GO_term_order=factor(as.integer(rownames(data)),labels=labels)COLS <- c("#66C3A5", "#8DA1CB", "#FD8D62")ggplot(data=data, aes(x=GO_term_order,y=Num_of_symbols_in_list_in_GO, fill=GO_category)) +geom_bar(stat="identity", width=0.8) +scale_fill_manual(values = COLS) + theme_bw() +xlab("GO term") + ylab("Num of Genes") + labs(title = "The Most Enriched GO Terms")+ theme(axis.text.x=element_text(face = "bold", color="gray50",angle = 70,vjust = 1, hjust = 1 ))

感謝各位的閱讀!關于“如何利用R語言的ggplot2包繪制GO富集柱形圖”這篇文章就分享到這里了,希望以上內容可以對大家有一定的幫助,讓大家可以學到更多知識,如果覺得文章不錯,可以把它分享出去讓更多的人看到吧!
免責聲明:本站發布的內容(圖片、視頻和文字)以原創、轉載和分享為主,文章觀點不代表本網站立場,如果涉及侵權請聯系站長郵箱:is@yisu.com進行舉報,并提供相關證據,一經查實,將立刻刪除涉嫌侵權內容。