您好,登錄后才能下訂單哦!
您好,登錄后才能下訂單哦!
這篇文章主要介紹“python模擬邏輯斯蒂回歸模型及最大熵模型舉例分析”,在日常操作中,相信很多人在python模擬邏輯斯蒂回歸模型及最大熵模型舉例分析問題上存在疑惑,小編查閱了各式資料,整理出簡單好用的操作方法,希望對大家解答”python模擬邏輯斯蒂回歸模型及最大熵模型舉例分析”的疑惑有所幫助!接下來,請跟著小編一起來學習吧!
思想:用了新的回歸函數y = 1/( exp(-x) ),其中x為分類函數,即w1*x1 + w2*x2 + ······ = 0。對于每一條樣本數據,我們計算一次y,并求出誤差△y;然后對權重向量w進行更新,更新策略為w = w + α*△y*x[i]' 其中α為學習率,△y為當前訓練數據的誤差,x[i]'為當前訓練數據的轉置;如此訓返往復。
這個例子中是對次數加了限制,也可以對誤差大小加以限制。
from math import exp
import numpy as np
import pandas as pd
import matplotlib.pyplot as plt
from sklearn.datasets import load_iris
from sklearn.model_selection import train_test_split


# data
def create_data():
    iris = load_iris()
    df = pd.DataFrame(iris.data, columns=iris.feature_names)
    df['label'] = iris.target
    df.columns = ['sepal length', 'sepal width', 'petal length', 'petal width', 'label']
    data = np.array(df.iloc[:100, [0, 1, -1]])
    # print(data)
    return data[:, :2], data[:, -1]


class LogisticReressionClassifier:
    def __init__(self, max_iter=200, learning_rate=0.01):
        self.max_iter = max_iter  # 對整個數據的最大訓練次數
        self.learning_rate = learning_rate  # 學習率

    def sigmoid(self, x):  # 回歸模型
        return 1 / (1 + exp(-x))

    # 對數據進行了整理,對原來的每行兩列添加了一列,
    # 因為我們的線性分類器:w1*x1 + w2*x2 + b*1.0
    # 所以將原來的(x1, x2,)擴充為(x1, x2, 1.0)
    def data_matrix(self, X):
        data_mat = []
        for d in X:
            data_mat.append([1.0, *d])
        return data_mat

    def fit(self, X, y):
        data_mat = self.data_matrix(X)  # 處理訓練數據
        # 生成權重數組
        # n行一列零數組,行數為data_mat[0]的長度
        # 這里也就是我們的 w0,w1,w2
        self.weights = np.zeros((len(data_mat[0]), 1), dtype=np.float32)

        for iter_ in range(self.max_iter):
            for i in range(len(X)):  # 對每條X進行遍歷
                # dot函數返回數組的點乘,也就是矩陣乘法:一行乘一列
                # 在這里就是將 向量w*向量x 傳入回歸模型
                # 返回訓練值
                result = self.sigmoid(np.dot(data_mat[i], self.weights))
                error = y[i] - result  # 誤差
                # transpose是轉置函數。改變權值
                # w = w + 學習率*誤差*向量x
                self.weights += self.learning_rate * error * np.transpose([data_mat[i]])
        print('邏輯斯諦回歸模型訓練完成(learning_rate={},max_iter={})'.format(
            self.learning_rate, self.max_iter))

    def score(self, X_test, y_test):
        right = 0
        X_test = self.data_matrix(X_test)
        for x, y in zip(X_test, y_test):
            result = np.dot(x, self.weights)
            if (result > 0 and y == 1) or (result < 0 and y == 0):
                right += 1
        return right / len(X_test)


X, y = create_data()
X_train, X_test, y_train, y_test = train_test_split(X, y, test_size=0.3)

lr_clf = LogisticReressionClassifier()
lr_clf.fit(X_train, y_train)
print("評分:")
print(lr_clf.score(X_test, y_test))
x_points = np.arange(4, 8)
# 原擬合函數為: w1*x1 + w2*x2 + b = 0
# 即           w1*x  +  w2*y + w0 = 0
y_ = -(lr_clf.weights[1]*x_points + lr_clf.weights[0])/lr_clf.weights[2]
plt.plot(x_points, y_)
plt.scatter(X[:50, 0], X[:50, 1], label='0')
plt.scatter(X[50:, 0], X[50:, 1], label='1')
plt.legend()
plt.show()
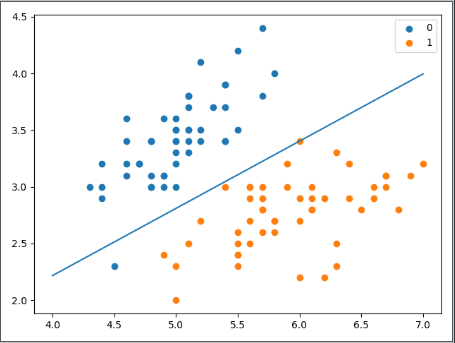
結果如下:
邏輯斯諦回歸模型訓練完成(learning_rate=0.01,max_iter=200)
評分:
1.0

from math import exp
import numpy as np
import pandas as pd
import matplotlib.pyplot as plt
from sklearn.datasets import load_iris
from sklearn.model_selection import train_test_split
from sklearn.linear_model import LogisticRegression


def create_data():
    iris = load_iris()
    df = pd.DataFrame(iris.data, columns=iris.feature_names)
    df['label'] = iris.target
    df.columns = ['sepal length', 'sepal width', 'petal length', 'petal width', 'label']
    data = np.array(df.iloc[:100, [0, 1, -1]])
    # print(data)
    return data[:, :2], data[:, -1]


X, y = create_data()
X_train, X_test, y_train, y_test = train_test_split(X, y, test_size=0.3)
clf = LogisticRegression(max_iter=200)
clf.fit(X_train, y_train)
print("socre:{}".format(clf.score(X_test, y_test)))
print(clf.coef_, clf.intercept_)
x_points = np.arange(4, 8)
y_ = -(clf.coef_[0][0]*x_points + clf.intercept_)/clf.coef_[0][1]
plt.plot(x_points, y_)
plt.plot(X[:50, 0], X[:50, 1], 'bo', color='blue', label='0')
plt.plot(X[50:, 0], X[50:, 1], 'bo', color='orange', label='1')
plt.xlabel('sepal length')
plt.ylabel('sepal width')
plt.legend()
plt.show()
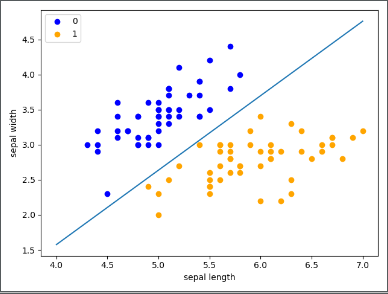
結果:
socre:1.0
[[ 2.72989376 -2.5726044 ]] [-6.86599549]

最大熵原理:在滿足約束條件的模型集合中選取熵最大的模型。
思想比較簡單,但公式太多,結合課本公式使用更佳
import math
from copy import deepcopy
# 深復制:將被復制的對象完全復制一份
# 淺復制:將被復制的對象打一個標簽,兩者改變其一,另一個隨著改變


class MaxEntropy:
    def __init__(self, EPS=0.005):  # 參數為收斂條件
        self._samples = []  # 存儲我們的訓練數據
        self._Y = set()  # 標簽集合,相當于去重后的y
        self._numXY = {}  # key為(x,y),value為出現次數
        self._N = 0  # 樣本數
        self._Ep_ = []  # 樣本分布的特征期望值
        self._xyID = {}  # key記錄(x,y),value記錄id號
        self._n = 0  # 所有特征鍵值(x,y)的個數
        self._C = 0  # 最大特征數
        self._IDxy = {}  # key為ID,value為對應的(x,y)
        self._w = []  #存我們的w系數
        self._EPS = EPS  # 收斂條件
        self._lastw = []  # 上一次w參數值

    def loadData(self, dataset):
        self._samples = deepcopy(dataset)
        for items in self._samples:
            y = items[0]
            X = items[1:]
            self._Y.add(y)  # 集合中y若已存在則會自動忽略
            for x in X:
                if (x, y) in self._numXY:
                    self._numXY[(x, y)] += 1
                else:
                    self._numXY[(x, y)] = 1

        self._N = len(self._samples)
        self._n = len(self._numXY)
        self._C = max([len(sample) - 1 for sample in self._samples])
        self._w = [0] * self._n  # w參數初始化為n個0,其中n為所有特征值數
        self._lastw = self._w[:]

        self._Ep_ = [0] * self._n
        # 計算特征函數fi關于經驗分布的期望
        # 其中i對應第幾條
        # xy對應(x, y)
        for i, xy in enumerate(self._numXY):
            self._Ep_[i] = self._numXY[xy] / self._N
            self._xyID[xy] = i
            self._IDxy[i] = xy

    def _Zx(self, X):  # 計算每個Z(x)值。其中Z(x)為規范化因子。
        zx = 0
        for y in self._Y:
            ss = 0
            for x in X:
                if (x, y) in self._numXY:
                    ss += self._w[self._xyID[(x, y)]]
            zx += math.exp(ss)
        return zx

    def _model_pyx(self, y, X):  # 計算每個P(y|x)
        zx = self._Zx(X)
        ss = 0
        for x in X:
            if (x, y) in self._numXY:
                ss += self._w[self._xyID[(x, y)]]
        pyx = math.exp(ss) / zx
        return pyx

    def _model_ep(self, index):  # 計算特征函數fi關于模型的期望
        x, y = self._IDxy[index]
        ep = 0
        for sample in self._samples:
            if x not in sample:
                continue
            pyx = self._model_pyx(y, sample)
            ep += pyx / self._N
        return ep

    def _convergence(self):  # 判斷是否全部收斂
        for last, now in zip(self._lastw, self._w):
            if abs(last - now) >= self._EPS:
                return False
        return True

    def predict(self, X):  # 計算預測概率
        Z = self._Zx(X)
        result = {}
        for y in self._Y:
            ss = 0
            for x in X:
                if (x, y) in self._numXY:
                    ss += self._w[self._xyID[(x, y)]]
            pyx = math.exp(ss) / Z
            result[y] = pyx
        return result

    def train(self, maxiter=1000):  # 訓練數據
        for loop in range(maxiter):  # 最大訓練次數
            self._lastw = self._w[:]
            for i in range(self._n):
                ep = self._model_ep(i)  # 計算第i個特征的模型期望
                self._w[i] += math.log(self._Ep_[i] / ep) / self._C  # 更新參數
            if self._convergence():  # 判斷是否收斂
                break


dataset = [['no', 'sunny', 'hot', 'high', 'FALSE'],
           ['no', 'sunny', 'hot', 'high', 'TRUE'],
           ['yes', 'overcast', 'hot', 'high', 'FALSE'],
           ['yes', 'rainy', 'mild', 'high', 'FALSE'],
           ['yes', 'rainy', 'cool', 'normal', 'FALSE'],
           ['no', 'rainy', 'cool', 'normal', 'TRUE'],
           ['yes', 'overcast', 'cool', 'normal', 'TRUE'],
           ['no', 'sunny', 'mild', 'high', 'FALSE'],
           ['yes', 'sunny', 'cool', 'normal', 'FALSE'],
           ['yes', 'rainy', 'mild', 'normal', 'FALSE'],
           ['yes', 'sunny', 'mild', 'normal', 'TRUE'],
           ['yes', 'overcast', 'mild', 'high', 'TRUE'],
           ['yes', 'overcast', 'hot', 'normal', 'FALSE'],
           ['no', 'rainy', 'mild', 'high', 'TRUE']]

maxent = MaxEntropy()
x = ['overcast', 'mild', 'high', 'FALSE']
maxent.loadData(dataset)
maxent.train()
print('predict:', maxent.predict(x))
結果:
predict: {'yes': 0.9999971802186581, 'no': 2.819781341881656e-06}到此,關于“python模擬邏輯斯蒂回歸模型及最大熵模型舉例分析”的學習就結束了,希望能夠解決大家的疑惑。理論與實踐的搭配能更好的幫助大家學習,快去試試吧!若想繼續學習更多相關知識,請繼續關注億速云網站,小編會繼續努力為大家帶來更多實用的文章!
免責聲明:本站發布的內容(圖片、視頻和文字)以原創、轉載和分享為主,文章觀點不代表本網站立場,如果涉及侵權請聯系站長郵箱:is@yisu.com進行舉報,并提供相關證據,一經查實,將立刻刪除涉嫌侵權內容。