您好,登錄后才能下訂單哦!
您好,登錄后才能下訂單哦!
本篇文章為大家展示了怎么在Android中實現一個多邊形統計圖,內容簡明扼要并且容易理解,絕對能使你眼前一亮,通過這篇文章的詳細介紹希望你能有所收獲。
 @Override
 protected void onDraw(Canvas canvas) {
 if (!canDraw()) {
 return;
 }
 canvas.translate(width / 2, height / 2);
 computeMaxPoint();
 drawPolygon(canvas);
 drawLine(canvas);
 drawArea(canvas);
 drawText(canvas);
 }
繪制多邊形
??繪制多邊形主要用到的是Path這個東西。具體的思路就是先計算好每個點的位置,同Path的lineTo方法連接起來,然后繪制。
??我的做法是先算出最大的半徑(再之后還會用到,建議單獨存起來),然后根據所在層數來計算每一層的半徑,利用cos函數各sin函數計算出每一層各頂點的位置。
計算最大半徑并且保存頂點
 @Override
 protected void onSizeChanged(int w, int h, int oldw, int oldh) {
 width = w;
 height = h;
 maxRadius = (float) ((width / 2) * 0.8);
 postInvalidate();
 }
/*
計算最大半徑,之后的位置都是基于最大半徑的比例
*/
public void computeMaxPoint() {
maxPointXList = new ArrayList<>();
maxPointYList = new ArrayList<>();
for (int i = 0; i < eageCount; i++) {
float currentAngle = i * angle - 90;
float currentX = (float) (maxRadius * Math.cos((currentAngle / 180) * Math.PI));
float currentY = (float) (maxRadius * Math.sin((currentAngle / 180) * Math.PI));
maxPointXList.add(currentX);
maxPointYList.add(currentY);
}
}??注意:cos和sin都是按照弧度制計算的,要換算。
??這里解釋一下為currentAngle什么要減去90度
??按照android的坐標系,如果不減去90度直接乘上cos的話,第一個頂點會默認在中心的右側,而一般的認知是第一個點在正上方,所以減去90度
按照比例和層數邊數繪制多邊形
 /*
 繪制多邊形和每一層
 */
 private void drawPolygon(Canvas canvas) {
 Path path = new Path();
 for (int i = 0; i < loopCount; i++) {
 path.reset();
 //依據最大半徑和角度來判斷每一層點的位置
 float rate = computeRate(i + 1, loopCount);
 for (int j = 0; j < eageCount; j++) {
 float currentX = maxPointXList.get(j) * rate;
 float currentY = maxPointYList.get(j) * rate;
 if (j == 0) {
  path.moveTo(currentX, currentY);
 } else {
  path.lineTo(currentX, currentY);
 }
 }
 path.close();
 canvas.drawPath(path, eagePaint);
 }
 }
??代碼還是很容易的吧,要是看不懂的話自己動手算算就知道了,很容易計算各個點的位置。
繪制連線
??由于之前保存了頂點的坐標,這個就很容易了
 /*
 畫出從中心向各頂點的連線
 */
 private void drawLine(Canvas canvas) {
 Path path = new Path();
 for (int i = 0; i < eageCount; i++) {
  path.reset();
  path.lineTo(maxPointXList.get(i), maxPointYList.get(i));
  canvas.drawPath(path, eagePaint);
 }
 }
繪制覆蓋區域
??這個原理其實和繪制多邊形是一樣的,就是對頂點坐標乘的比例發生了變化。每個方向的數值是由用戶傳遞進來的。
 /*
 繪制個方向值覆蓋的區域
 */
 private void drawArea(Canvas canvas) {
 Path path = new Path();
 //原理就是用path根據各方向值創建一個封閉的區域,然后填充
 for (int i = 0; i < eageCount; i++) {
  float rate = pointValue.get(i);
  float currentX = maxPointXList.get(i) * rate;
  float currentY = maxPointYList.get(i) * rate;
  if (i == 0) {
  path.moveTo(currentX, currentY);
  } else {
  path.lineTo(currentX, currentY);
  }
 }
 path.close();
 canvas.drawPath(path, areaPaint);
 }
繪制文字
??說實話,前面的沒有什么難點,但是唯獨繪制文字有許多麻煩事。主要是文字是默認自左向右的,最上面和最先面的文字倒是沒啥,左側和右側的文字就會出現問題了,文字會繪制到多邊形上,看起來特別難受。這里我的解決辦法就是前面圖中看到的,讓字跟著多邊形的頂點位置一起旋轉。
 /*
 繪制文字
 */
 private void drawText(Canvas canvas) {
 if (pointName == null) {
  return;
 }
 //繪制文字的難點在于無法最好的適配屏幕的位置,會發生難以控制的偏倚
 for (int i = 0; i < pointName.size(); i++) {
  //解決辦法就是讓文字在不同的角度也發生旋轉,并且在x軸上減去一定的數值來保證正確的位置
  float currentAngle = i * angle;
  //180度需要也別的處理,讓它正著顯示,不然就是倒著的
  if (currentAngle == 180) {
  float currentX = maxPointXList.get(i) * 1.1f;
  float currentY = maxPointYList.get(i) * 1.1f;
  canvas.drawText(pointName.get(i), currentX - (textPaint.getTextSize() / 4)
   * (pointName.get(i).length()), currentY, textPaint);
  } else {
  canvas.save();
  float currentX = maxPointXList.get(0) * 1.1f;
  float currentY = maxPointYList.get(0) * 1.1f;
  //旋轉畫布,達到旋轉文字的效果
  canvas.rotate(currentAngle);
  canvas.drawText(pointName.get(i), currentX - (textPaint.getTextSize() / 4)
   * (pointName.get(i).length()), currentY, textPaint);
  canvas.restore();
  }
 }
 }
到這里,整個組件就繪制完成了
額外的屬性
如果單純只是想畫出這個組件來,其實沒啥難度。我們可以在加一些別的東西讓他更加實用。
動畫效果
??利用屬性動畫的知識,我們可以做到讓中間的填充區域慢慢的擴散出來。原理也簡單,就是把0到1用屬性計算展開,當做一個演化的比例,讓各個方向的值乘上這個數值,繪制一個比原先覆蓋區域小的區域就可以了。
 /*
 用屬性動畫繪制組件
 */
 public void draw() {
 if (canDraw()) {
  final Float[] trueValues = pointValue.toArray(new Float[pointValue.size()]);
  ValueAnimator valueAnimator = ValueAnimator.ofFloat(0, 1);
  valueAnimator.setDuration(1000);
  valueAnimator.addUpdateListener(new ValueAnimator.AnimatorUpdateListener() {
  @Override
  public void onAnimationUpdate(ValueAnimator animation) {
   float rate = animation.getAnimatedFraction();
   for (int i = 0; i < pointValue.size(); i++) {
   pointValue.set(i, trueValues[i] * rate);
   }
   invalidate();
  }
  });
  valueAnimator.start();
 }
 }
定義xml屬性
??我們正常使用系統組件的時候都會寫一大堆的xml來控制我們組件的屬性,自定義View也可以嘗試這些
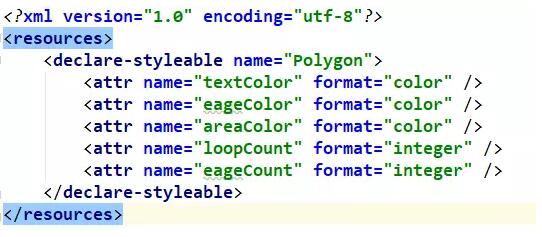
??首先在value下創建atts文件

??然后指定你想要的屬性名稱和類型

??再然后就是讓atts和我們的view聯系上。這個也簡單,仔細觀察View的構造方法中的參數,有這么一個玩意 AttributeSet attrs
public PolygonView(Context context, @Nullable AttributeSet attrs) {
 super(context, attrs);
 init(context, attrs);
 }
 public PolygonView(Context context, @Nullable AttributeSet attrs, int defStyleAttr) {
 super(context, attrs, defStyleAttr);
 init(context, attrs);
 }
??它就是聯系xml和view的紐帶
xmlns:app="http://schemas.android.com/apk/res-auto"
<com.totoro.xkf.polygonview.PolygonView
 android:id="@+id/pv_polygon_view"
 android:layout_width="match_parent"
 android:layout_height="match_parent"
 app:areaColor="@android:color/holo_blue_light"
 app:eageColor="@android:color/black"
 app:eageCount="6"
 app:loopCount="4"
 app:textColor="@android:color/black" />
public void init(Context context, AttributeSet attrs) {
 TypedArray typedArray = context.obtainStyledAttributes(attrs, R.styleable.Polygon);
 initPaint();
 setTextColor(typedArray.getColor(R.styleable.Polygon_textColor, Color.BLACK));
 setLoopCount(typedArray.getInteger(R.styleable.Polygon_loopCount, 0));
 setEageCount(typedArray.getInteger(R.styleable.Polygon_eageCount, 0));
 setAreaColor(typedArray.getColor(R.styleable.Polygon_areaColor, Color.BLUE));
 setEageColor(typedArray.getColor(R.styleable.Polygon_eageColor, Color.GRAY));
 typedArray.recycle();
 }
xmlns:app=http://schemas.android.com/apk/res-auto
上述內容就是怎么在Android中實現一個多邊形統計圖,你們學到知識或技能了嗎?如果還想學到更多技能或者豐富自己的知識儲備,歡迎關注億速云行業資訊頻道。
免責聲明:本站發布的內容(圖片、視頻和文字)以原創、轉載和分享為主,文章觀點不代表本網站立場,如果涉及侵權請聯系站長郵箱:is@yisu.com進行舉報,并提供相關證據,一經查實,將立刻刪除涉嫌侵權內容。