溫馨提示×
您好,登錄后才能下訂單哦!
點擊 登錄注冊 即表示同意《億速云用戶服務條款》
您好,登錄后才能下訂單哦!
怎么在python中使用matplotlib實現一個雙Y軸?相信很多沒有經驗的人對此束手無策,為此本文總結了問題出現的原因和解決方法,通過這篇文章希望你能解決這個問題。
Python是一種編程語言,內置了許多有效的工具,Python幾乎無所不能,該語言通俗易懂、容易入門、功能強大,在許多領域中都有廣泛的應用,例如最熱門的大數據分析,人工智能,Web開發等。
如下所示:
import matplotlib.pyplot as plt
import numpy as np

x = np.arange(0., np.e, 0.01)
y1 = np.exp(-x)
y2 = np.log(x)
fig = plt.figure()
ax1 = fig.add_subplot(111)
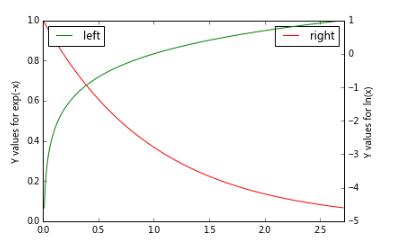
ax1.plot(x, y1,'r',label="right");
ax1.legend(loc=1)
ax1.set_ylabel('Y values for exp(-x)');
ax2 = ax1.twinx() # this is the important function
ax2.plot(x, y2, 'g',label = "left")
ax2.legend(loc=2)
ax2.set_xlim([0, np.e]);
ax2.set_ylabel('Y values for ln(x)');
ax2.set_xlabel('Same X for both exp(-x) and ln(x)');
plt.show()
結果為:

看完上述內容,你們掌握怎么在python中使用matplotlib實現一個雙Y軸的方法了嗎?如果還想學到更多技能或想了解更多相關內容,歡迎關注億速云行業資訊頻道,感謝各位的閱讀!
免責聲明:本站發布的內容(圖片、視頻和文字)以原創、轉載和分享為主,文章觀點不代表本網站立場,如果涉及侵權請聯系站長郵箱:is@yisu.com進行舉報,并提供相關證據,一經查實,將立刻刪除涉嫌侵權內容。