溫馨提示×
您好,登錄后才能下訂單哦!
點擊 登錄注冊 即表示同意《億速云用戶服務條款》
您好,登錄后才能下訂單哦!
這篇文章主要介紹了vue3怎么封裝ECharts組件的相關知識,內容詳細易懂,操作簡單快捷,具有一定借鑒價值,相信大家閱讀完這篇vue3怎么封裝ECharts組件文章都會有所收獲,下面我們一起來看看吧。
前端開發需要經常使用ECharts圖表渲染數據信息,在一個項目中我們經常需要使用多個圖表,選擇封裝ECharts組件復用的方式可以減少代碼量,增加開發效率。
避免重復的工作量,提升復用性
使代碼邏輯更加清晰,方便項目的后期維護
封裝組件可以讓使用者不去關心組件的內部實現以及原理,能夠使一個團隊更好的有層次的去運行
封裝的ECharts組件實現了以下的功能:
使用組件傳遞ECharts中的 option 屬性
手動/自動設置chart尺寸
chart自適應寬高
動態展示獲取到的后端數據
本文使用的是vue3 + typescript的寫法。
<template>
  <div :id="id" :class="className" : />
</template>
<script setup lang="ts">
//按需導入需要用到的 vue函數 和 echarts
import { onMounted, onBeforeUnmount, defineProps, watch } from "vue";
import * as echarts from 'echarts';
//獲取 dom 和 父組件數據 并定義"myChart"用于初始化圖表
let myChart: echarts.ECharts;
const props = defineProps({
  id: {
    type: String,
    default: 'chart',
    required: true
  },
  className: {
    type: String,
    default: ''
  },
  width: {
    type: String,
    default: '100%',
  },
  height: {
    type: String,
    default: '300px',
  },
  loading: {
    type: Boolean,
    default: true,
  },
  fullOptions: {
    type: Object,
    default: () => ({}),
    required: true
  },
})
//重繪圖表函數
const resizeHandler = () => {
  myChart.resize();
}
//設置防抖,保證無論拖動窗口大小,只執行一次獲取瀏覽器寬高的方法
const debounce = (fun: { (): void; (): void; }, delay: number | undefined) => {
  let timer: number | undefined;
  return function () {
    if (timer) {
      clearTimeout(timer);
    }
    timer = setTimeout(() => {
      fun();
    }, delay);
  }
};
const cancalDebounce = debounce(resizeHandler, 50);
//頁面成功渲染,開始繪制圖表
onMounted(() => {
  //配置為 svg 形式,預防頁面縮放而出現模糊問題;圖表過于復雜時建議使用 Canvas
  myChart = echarts.init(document.getElementById(props.id) as HTMLDivElement, { renderer: 'svg' })
  myChart.showLoading({
    text: '',
    color: '#409eff',
    textColor: '#000',
    maskColor: 'rgba(255, 255, 255, .95)',
    zlevel: 0,
    lineWidth: 2,
  });
  if (!props.loading) {
    myChart.hideLoading();
    myChart.setOption(props.fullOptions.options, true);
  }
  //自適應不同屏幕時改變圖表尺寸
  window.addEventListener('resize', cancalDebounce);
})
//頁面銷毀前,銷毀事件和實例
onBeforeUnmount(() => {
  window.removeEventListener('resize', cancalDebounce)
  myChart.dispose()
})
//監聽圖表數據時候變化,重新渲染圖表
watch(() => [props.fullOptions.options, props.loading], () => {
  if (!props.loading) {
    myChart.hideLoading();
    myChart.setOption(props.fullOptions.options, true);
  }
}, { deep: true })
</script><template>
<Echarts
id="echarts"
height="300px"
:full-options="echartsOptions"
:loading="loading"
>
</Echarts>
</template>
<script setup lang="ts">
// 引進Echarts 組件
import Echarts from '@/components/Echarts/Echarts.vue';
// 引進Echarts 的options配置文件,可根據項目模塊來創建該配置文件
import chartOption from '@/components/Echarts/options';
const echartsOptions = reactive({
options: { },
init: false
});
// 此處可請求接口來獲取數據
// 我的options配置使用的是dataset的形式,傳進options中的兩個參數data(圖表的數據)和dimension(圖表的維度),
onMounted(() => {
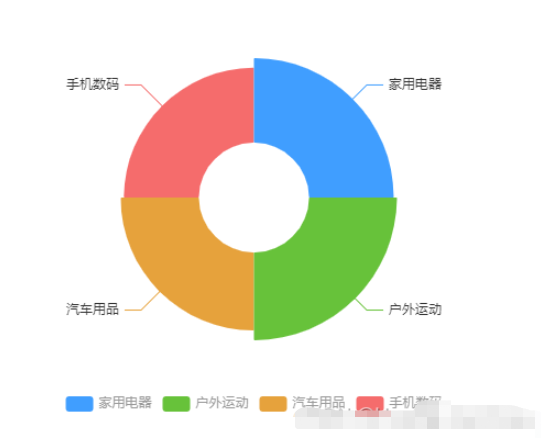
const testData = [26,27,24,23];
const testDimensions = ['家用電器','戶外運動','汽車用品','手機數碼'];
echartsOptions.options = chartOption.testOption(testData, testDimensions);
});
</script>效果:

關于“vue3怎么封裝ECharts組件”這篇文章的內容就介紹到這里,感謝各位的閱讀!相信大家對“vue3怎么封裝ECharts組件”知識都有一定的了解,大家如果還想學習更多知識,歡迎關注億速云行業資訊頻道。
免責聲明:本站發布的內容(圖片、視頻和文字)以原創、轉載和分享為主,文章觀點不代表本網站立場,如果涉及侵權請聯系站長郵箱:is@yisu.com進行舉報,并提供相關證據,一經查實,將立刻刪除涉嫌侵權內容。