您好,登錄后才能下訂單哦!
您好,登錄后才能下訂單哦!
今天小編給大家分享一下怎么用Python獲取和存儲時間序列數據的相關知識點,內容詳細,邏輯清晰,相信大部分人都還太了解這方面的知識,所以分享這篇文章給大家參考一下,希望大家閱讀完這篇文章后有所收獲,下面我們一起來了解一下吧。
本教程在通過Homebrew已安裝Python 3的macOS系統上完成。建議安裝額外的工具,比如virtualenv、pyenv或conda-env,以簡化Python和Client的安裝。完整的要求在這里:
txt
influxdb-client=1.30.0
pandas=1.4.3
requests>=2.27.1
本教程還假設您已經創建Free Tier InfluxDB云帳戶或正在使用InfluxDB OSS,您也已經:
創建了存儲桶。您可以將存儲桶視為數據庫或InfluxDB中最高層次的數據組織。
創建了令牌。
最后,該教程要求您已經使用OpenWeatherMap創建了一個帳戶,并已創建了令牌。
首先,我們需要請求數據。我們將使用請求庫,通過OpenWeatherMap API從指定的經度和緯度返回每小時的天氣數據。
# Get time series data from OpenWeatherMap API
params = {'lat':openWeatherMap_lat, 'lon':openWeatherMap_lon, 'exclude':
"minutely,daily", 'appid':openWeatherMap_token}
r = requests.get(openWeather_url, params = params).json()
hourly = r['hourly']接下來,將JSON數據轉換成Pandas DataFrame。我們還將時間戳從秒精度的Unix時間戳轉換成日期時間對象。之所以進行這種轉換,是由于InfluxDB寫入方法要求時間戳為日期時間對象格式。接下來,我們將使用這種方法,將數據寫入到InfluxDB。我們還刪除了不想寫入到InfluxDB的列。
python
# Convert data to Pandas DataFrame and convert timestamp to datetime
object
df = pd.json_normalize(hourly)
df = df.drop(columns=['weather', 'pop'])
df['dt'] = pd.to_datetime(df['dt'], unit='s')
print(df.head)
現在為InfluxDB Python客戶端庫創建實例,并將DataFrame寫入到InfluxDB。我們指定了測量名稱。測量含有存儲桶中的數據。您可以將其視為InfluxDB的數據組織中僅次于存儲桶的第二高層次結構。
您還可以使用data_frame__tag_columns參數指定將哪些列轉換成標簽。
由于我們沒有將任何列指定為標簽,我們的所有列都將轉換成InfluxDB中的字段。標簽用于寫入有關您的時間序列數據的元數據,可用于更有效地查詢數據子集。字段是您在 InfluxDB中存儲實際時間序列數據的位置。
on
# Write data to InfluxDB
with InfluxDBClient(url=url, token=token, org=org) as client:
df = df
client.write_api(write_options=SYNCHRONOUS).write(bucket=bucket,record=df,
data_frame_measurement_name="weather",
data_frame_timestamp_column="dt")
回顧一下,不妨看看完整的腳本。 我們采取以下步驟:
1. 導入庫。
2. 收集以下內容:
InfluxDB存儲桶
InfluxDB組織
InfluxDB令牌
InfluxDB URL
OpenWeatherMap URL
OpenWeatherMap 令牌
3. 創建請求。
4. 將JSON響應轉換成Pandas DataFrame。
5. 刪除您不想寫入到InfluxDB的任何列。
6. 將時間戳列從Unix時間轉換成Pandas日期時間對象。
7. 為InfluxDB Python Client庫創建實例。
8. 編寫DataFrame,并指定測量名稱和時間戳列。
python
import requests
import influxdb_client
import pandas as pd
from influxdb_client import InfluxDBClient
from influxdb_client.client.write_api import SYNCHRONOUS
bucket = "OpenWeather"
org = "" # or email you used to create your Free Tier
InfluxDB Cloud account
token = "
url = "" # for example,
https://us-west-2-1.aws.cloud2.influxdata.com/
openWeatherMap_token = ""
openWeatherMap_lat = "33.44"
openWeatherMap_lon = "-94.04"
openWeather_url = "https://api.openweathermap.org/data/2.5/onecall"
# Get time series data from OpenWeatherMap API
params = {'lat':openWeatherMap_lat, 'lon':openWeatherMap_lon, 'exclude':
"minutely,daily", 'appid':openWeatherMap_token}
r = requests.get(openWeather_url, params = params).json()
hourly = r['hourly']
# Convert data to Pandas DataFrame and convert timestamp to datetime
object
df = pd.json_normalize(hourly)
df = df.drop(columns=['weather', 'pop'])
df['dt'] = pd.to_datetime(df['dt'], unit='s')
print(df.head)
# Write data to InfluxDB
with InfluxDBClient(url=url, token=token, org=org) as client:
df = df
client.write_api(write_options=SYNCHRONOUS).write(bucket=bucket,record=df,
data_frame_measurement_name="weather",
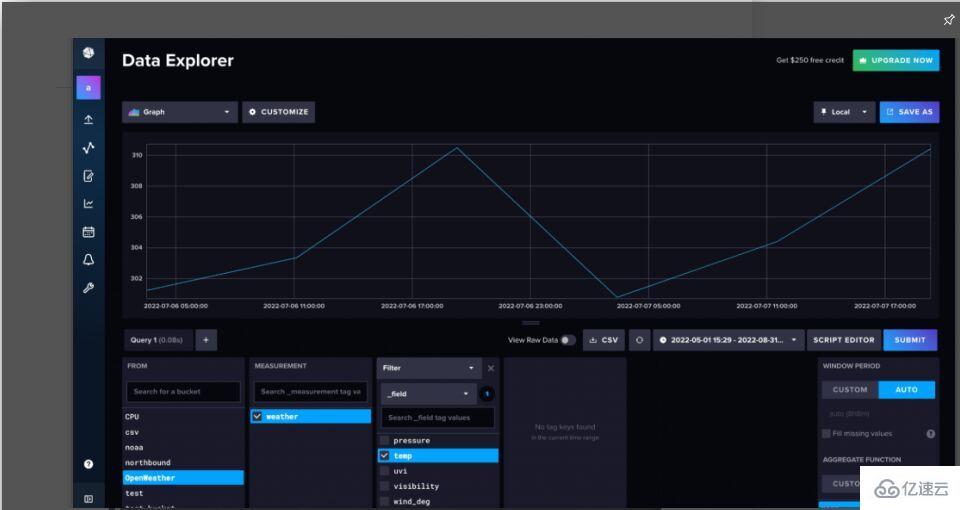
data_frame_timestamp_column="dt")現在,我們已經將數據寫入到InfluxDB,可以使用InfluxDB UI來查詢數據了。導航到數據資源管理器(從左側導航欄中)。使用Query Builder(查詢構建器),選擇想要可視化的數據和想要為之可視化的范圍,然后點擊“提交”。

圖1. 天氣數據的默認物化視圖。InfluxDB自動聚合時間序列數據,這樣新用戶就不會意外查詢太多數據而導致超時
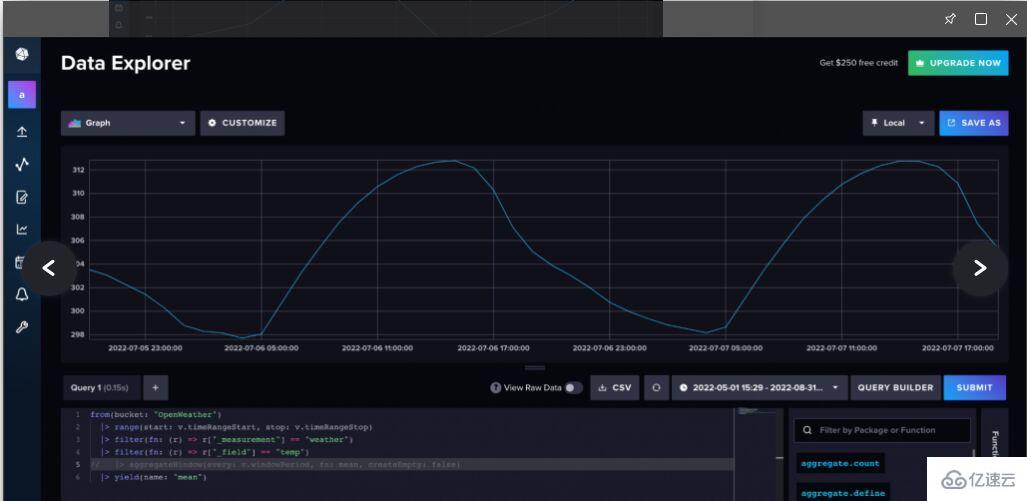
專業提示:當您使用查詢構建器查詢數據時,InfluxDB自動對數據進行下采樣。要查詢原始數據,導航到Script Editor(腳本編輯器)以查看底層Flux查詢。Flux是面向InfluxDB的原生查詢和腳本語言,可用于使用您的時間序列數據來分析和創建預測。使用aggregateWindow()函數取消行注釋或刪除行,以查看原始數據。

圖2. 導航到腳本編輯器,并取消注釋或刪除aggregateWindow()函數,以查看原始天氣數據
以上就是“怎么用Python獲取和存儲時間序列數據”這篇文章的所有內容,感謝各位的閱讀!相信大家閱讀完這篇文章都有很大的收獲,小編每天都會為大家更新不同的知識,如果還想學習更多的知識,請關注億速云行業資訊頻道。
免責聲明:本站發布的內容(圖片、視頻和文字)以原創、轉載和分享為主,文章觀點不代表本網站立場,如果涉及侵權請聯系站長郵箱:is@yisu.com進行舉報,并提供相關證據,一經查實,將立刻刪除涉嫌侵權內容。