您好,登錄后才能下訂單哦!
您好,登錄后才能下訂單哦!
這篇文章主要介紹了如何使用Python對網易云歌單數據分析及可視化的相關知識,內容詳細易懂,操作簡單快捷,具有一定借鑒價值,相信大家閱讀完這篇如何使用Python對網易云歌單數據分析及可視化文章都會有所收獲,下面我們一起來看看吧。
網易云音樂是一款由網易開發的音樂產品,是網易杭州研究院的成果 ,依托專業音樂人、DJ、好友推薦及社交功能,在線音樂服務主打歌單、社交、大牌推薦和音樂指紋,以歌單、DJ節目、社交、地理位置為核心要素,主打發現和分享。對網易云音樂官網歌單部分進行爬取,對網易云音樂歌單進行數據獲取,獲取某一歌曲風格的所有歌單,并獲取歌單的名稱、標簽、介紹、收藏量、播放量、歌單收錄的歌曲數目,以及評論數。
對爬取到的數據進行預處理,在對預處理的數據進行分析,對歌單播放量、歌單收藏量、歌單評論量、歌單歌曲收錄情況,、歌單標簽,歌單貢獻up主等進行分析,并進行可視化,將分析結果更直觀的反映出來。
聽音樂音樂是當今很多年輕人抒發情感的方式,網易云音樂是一個大眾化的音樂平臺,可以通過對網易云音樂的歌單情況進行分析,從而了解到當今社會年輕人所面對的問題,以及各方面情感壓力;還可以了解到用戶的喜好,分析出什么樣的歌歌單最受大眾歡迎,還可以反應大眾的喜好,對音樂創作人的創作也有著很重要的作用。從廣大普通用戶的角度來看,對于歌單的創建者,創建歌單一方面便于對自己收藏的音樂曲庫進行分類管理,另一方面,生產出優質的歌單可以凸顯自己的音樂品味,收獲點贊與評論,得到極大的成就感與滿足感。而對于歌單的消費者來說,基于“歌單”聽歌可以大大地提升聽歌的用戶體驗。對于音樂人以及電臺主持等類型的歌單創建者來講,通過“歌單”可以更好地傳播自己的音樂與作品,也可以更好地與粉絲互動并擴大知名度。
本次項目爬取的是網易云官網華語歌單部分的數據,爬取地址為:華語歌單 - 歌單 - 網易云音樂
進入每一個頁面,獲取該頁面的每一個歌單,進入單個歌單中,歌單名,收藏量,評論數,標簽,介紹,歌曲總數,播放量,收錄的歌名等數據都存放在網頁的同一個div內,通過selector選擇器選擇各個內容。
from bs4 import BeautifulSoup
import requests
import time

headers = {
    'User-Agent': 'Mozilla/5.0 (Windows NT 6.1; WOW64) AppleWebKit/537.36 (KHTML, like Gecko) Chrome/63.0.3239.132 Safari/537.36'
}

for i in range(0, 1330, 35):
    print(i)
    time.sleep(2)
    url = 'https://music.163.com/discover/playlist/?cat=華語&order=hot&limit=35&offset=' + str(i)#修改這里即可
    response = requests.get(url=url, headers=headers)
    html = response.text
    soup = BeautifulSoup(html, 'html.parser')
    # 獲取包含歌單詳情頁網址的標簽
    ids = soup.select('.dec a')
    # 獲取包含歌單索引頁信息的標簽
    lis = soup.select('#m-pl-container li')
    print(len(lis))
    for j in range(len(lis)):
        # 獲取歌單詳情頁地址
        url = ids[j]['href']
        # 獲取歌單標題
        title = ids[j]['title']
        # 獲取歌單播放量
        play = lis[j].select('.nb')[0].get_text()
        # 獲取歌單貢獻者名字
        user = lis[j].select('p')[1].select('a')[0].get_text()
        # 輸出歌單索引頁信息
        print(url, title, play, user)
        # 將信息寫入CSV文件中
        with open('playlist.csv', 'a+', encoding='utf-8-sig') as f:
            f.write(url + ',' + title + ',' + play + ',' + user + '\n')

from bs4 import BeautifulSoup
import pandas as pd
import requests
import time

df = pd.read_csv('playlist.csv', header=None, error_bad_lines=False, names=['url', 'title', 'play', 'user'])

headers = {
    'User-Agent': 'Mozilla/5.0 (Windows NT 6.1; WOW64) AppleWebKit/537.36 (KHTML, like Gecko) Chrome/63.0.3239.132 Safari/537.36'
}

for i in df['url']:
    time.sleep(2)
    url = 'https://music.163.com' + i
    response = requests.get(url=url, headers=headers)
    html = response.text
    soup = BeautifulSoup(html, 'html.parser')
    # 獲取歌單標題
    title = soup.select('h3')[0].get_text().replace(',', ',')
    # 獲取標簽
    tags = []
    tags_message = soup.select('.u-tag i')
    for p in tags_message:
        tags.append(p.get_text())
    # 對標簽進行格式化
    if len(tags) > 1:
        tag = '-'.join(tags)
    else:
        tag = tags[0]
    # 獲取歌單介紹
    if soup.select('#album-desc-more'):
        text = soup.select('#album-desc-more')[0].get_text().replace('\n', '').replace(',', ',')
    else:
        text = '無'
    # 獲取歌單收藏量
    collection = soup.select('#content-operation i')[1].get_text().replace('(', '').replace(')', '')
    # 歌單播放量
    play = soup.select('.s-fc6')[0].get_text()
    # 歌單內歌曲數
    songs = soup.select('#playlist-track-count')[0].get_text()
    # 歌單評論數
    comments = soup.select('#cnt_comment_count')[0].get_text()
    # 輸出歌單詳情頁信息
    print(title, tag, text, collection, play, songs, comments)
    # 將詳情頁信息寫入CSV文件中
    with open('music_message.csv', 'a+', encoding='utf-8') as f:
        # f.write(title + '/' + tag + '/' + text + '/' + collection + '/' + play + '/' + songs + '/' + comments + '\n')
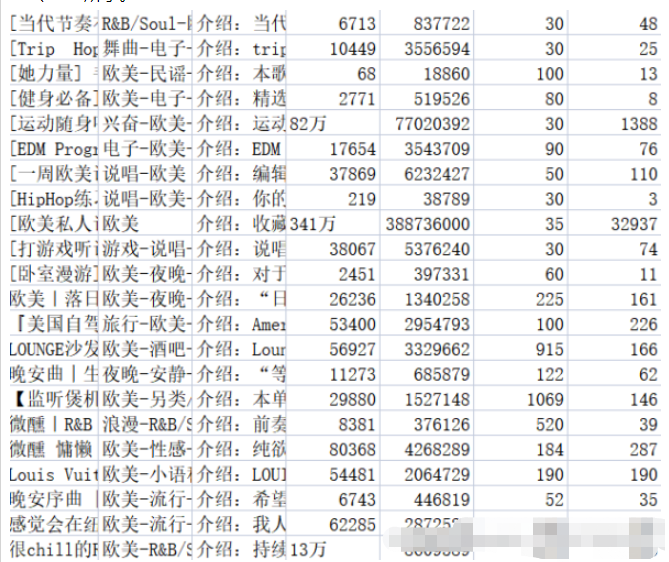
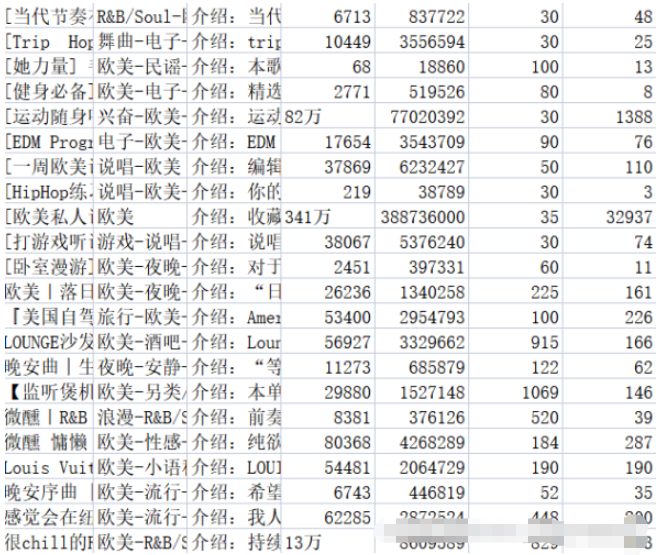
f.write(title + ',' + tag + ',' + text + ',' + collection + ',' + play + ',' + songs + ',' + comments + '\n')將相關內容存放至相應的.csv文件中,music_message.csv文件中存放了獲取歌單的名稱、標簽、介紹、收藏量、播放量、歌單收錄的歌曲數目,以及評論數。playlist.csv文件中存放了歌單詳情頁地址,歌單標題,歌單播放量,以及歌單貢獻者名字。結果如圖2-1、2-2所示。
關于數據的清洗,實際上在上一部分抓取數據的過程中已經做了一部分,包括:后臺返回的空歌單信息、重復數據的去重等。除此之外,還要進行一些清洗:將評論量數據統一格式等。
將評論數中數據帶“萬”的數據,用“0000”替換“萬”便于后續的數據分析,將評論數中數據統計出錯的數據用“0”填充,不參與后續統計。
df['collection'] = df['collection'].astype('string').str.strip()
df['collection'] = [int(str(i).replace('萬','0000')) for i in df['collection']]
df['text'] = [str(i)[3:] for i in df['text']]
df['comments'] = [0 if '評論' in str(i).strip() else int(i) for i in df['comments']]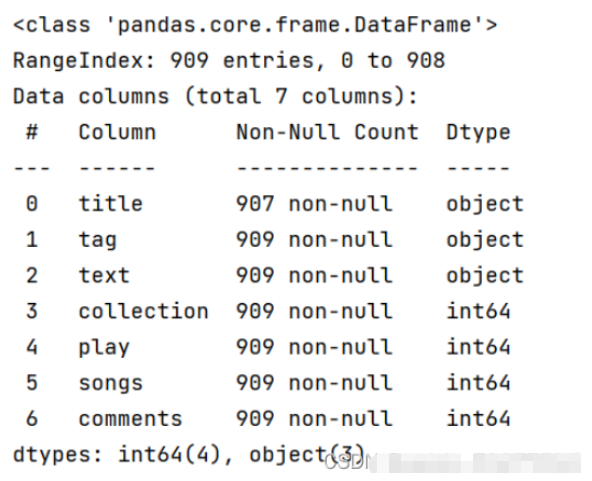
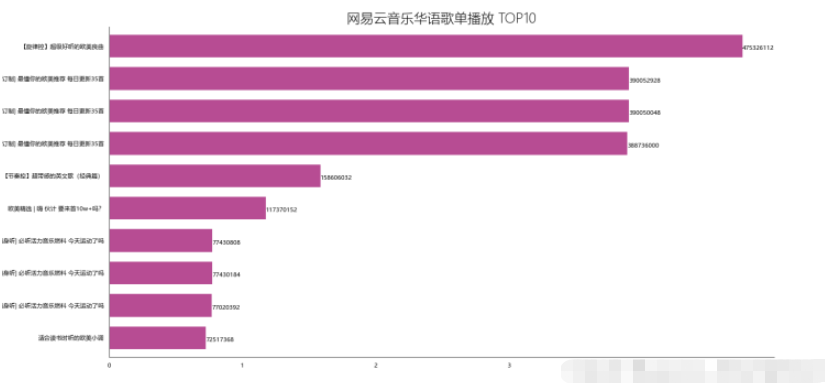
df_play = df[['title','play']].sort_values('play',ascending=False)
df_play[:10]
df_play = df_play[:10]
_x = df_play['title'].tolist()
_y = df_play['play'].tolist()
df_play = get_matplot(x=_x,y=_y,chart='barh',title='網易云音樂華語歌單播放 TOP10',ha='left',size=8,color=color[0])
df_play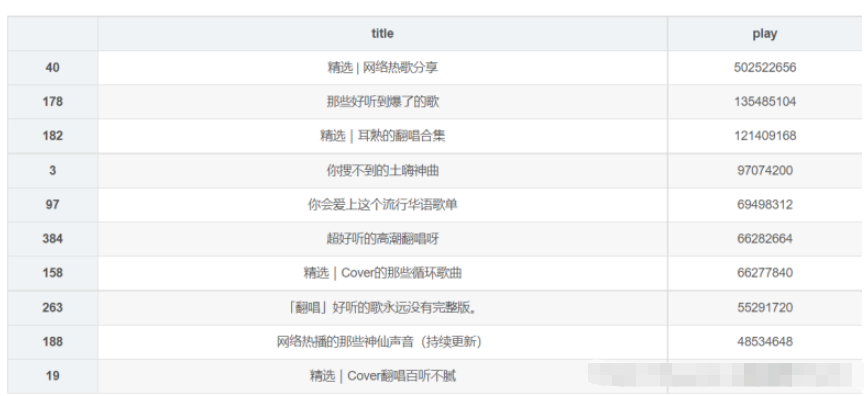
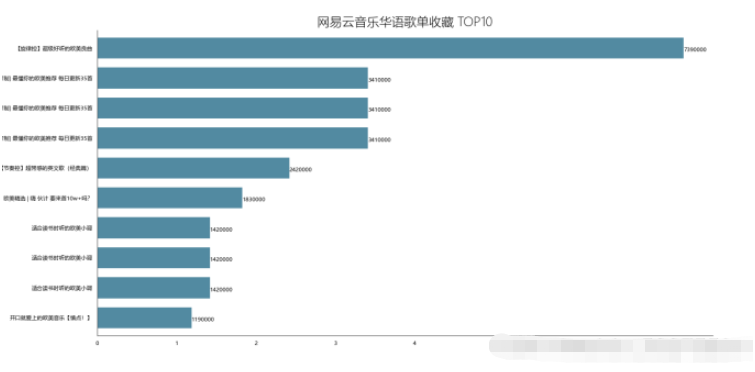
df_col = df[['title','collection']].sort_values('collection',ascending=False)
df_col[:10]
df_col = df_col[:10]
_x = df_col['title'].tolist()
_y = df_col['collection'].tolist()
df_col = get_matplot(x=_x,y=_y,chart='barh',title='網易云音樂華語歌單收藏 TOP10',ha='left',size=8,color=color[1])
df_col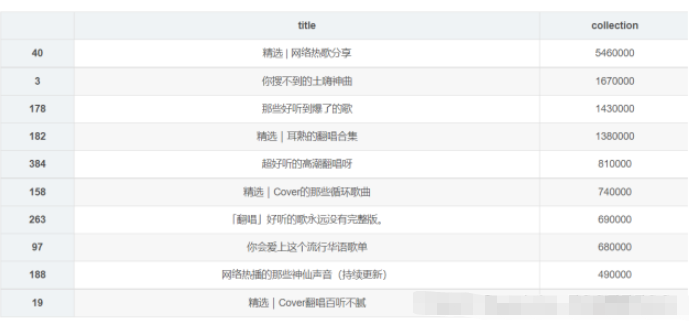
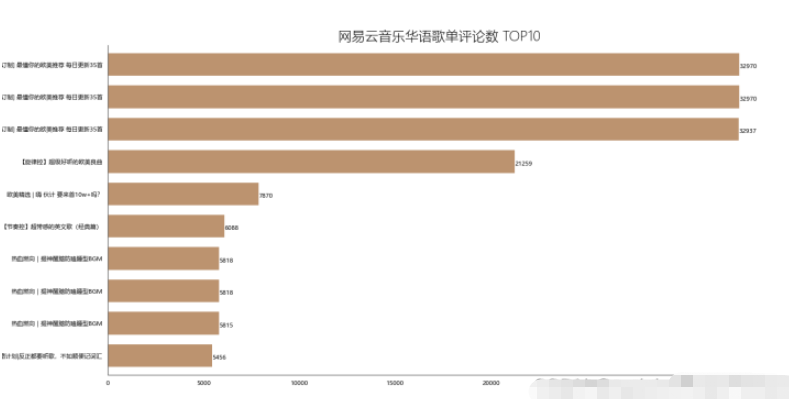
df_com = df[['title','comments']].sort_values('comments',ascending=False)
df_com[:10]
df_com = df_com[:10]
_x = df_com['title'].tolist()
_y = df_com['comments'].tolist()
df_com = get_matplot(x=_x,y=_y,chart='barh',title='網易云音樂華語歌單評論數 TOP10',ha='left',size=8,color=color[2])
df_com
df_songs = np.log(df['songs'])
df_songs
df_songs = get_matplot(x=0,y=df_songs,chart='hist',title='華語歌單歌曲收錄分布情況',ha='left',size=10,color=color[3])
df_songs
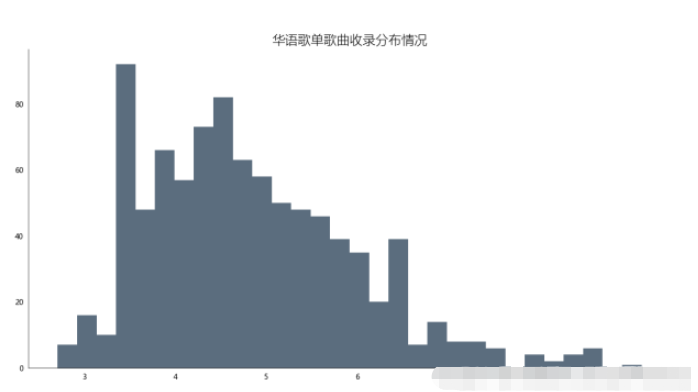
通過對柱形圖分析發現,歌單對歌曲的收錄情況多數集中在20-60首歌曲,至多超過80首,也存在空歌單現象,但絕大多數歌單收錄歌曲均超過10首左右。通過本次可視化分析可以使得后續創作者對自己創作歌單的歌曲收錄情況提供幫助。也能夠更受大眾歡迎。
def get_tag(df):
    df = df['tag'].str.split('-')
    datalist = list(set(x for data in df for x in data))
    return  datalist
df_tag = get_tag(df)
# df_tag
def get_lx(x,i):
    if i in str(x):
        return 1
    else:
        return 0
for i in list(df_tag):#這里的df['all_category'].unique()也可以自己用列表構建,我這里是利用了前面獲得的
    df[i] = df['tag'].apply(get_lx,i=f'{i}')
# df.head()
Series = df.iloc[:,7:].sum().sort_values(0,ascending=False)
df_tag = [tag for tag in zip(Series.index.tolist(),Series.values.tolist())]
df_tag[:10]
df_iex = [index for index in Series.index.tolist()][:20]
df_tag = [tag for tag in Series.values.tolist()][:20]
df_tagiex = get_matplot(x=df_iex,y=df_tag,chart='plot',title='網易云音樂華語歌單標簽圖',size=10,ha='center',color=color[3])
df_tagiex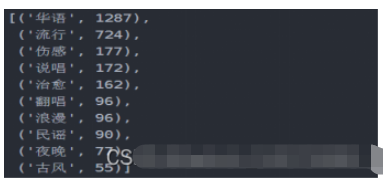
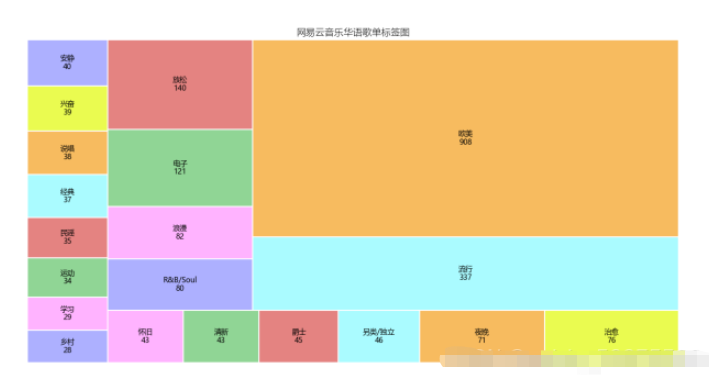
可以通過此標簽圖看出歌單的風格,可以分析出目前的主流歌曲的情感,以及大眾的需求,也網易云音樂用戶的音樂偏好,據此可以看出,網易云音樂用戶,在音樂偏好上比較多元化:國內流行、歐美流行、電子、 等各種風格均有涉及。
df_user = pd.read_csv('playlist.csv',encoding="unicode_escape",header=0,names=['url','title','play','user'],sep=',')
df_user.shape
df_user = df_user.iloc[:,1:]
df_user['count'] = 0
df_user = df_user.groupby('user',as_index=False)['count'].count()
df_user = df_user.sort_values('count',ascending=False)[:10]
df_user
df_user = df_user[:10]
names = df_user['user'].tolist()
nums = df_user['count'].tolist()
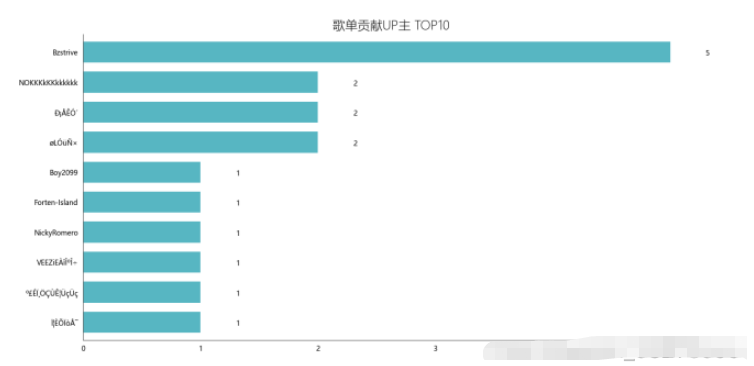
df_u = get_matplot(x=names,y=nums,chart='barh',title='歌單貢獻UP主 TOP10',ha='left',size=10,color=color[4])
df_u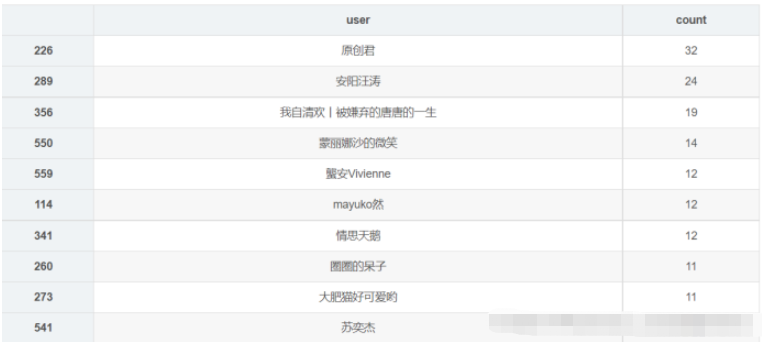
import wordcloud
import pandas as pd
import numpy as np
from PIL import Image
data = pd.read_excel('music_message.xlsx')
#根據播放量排序,只取前五十個
data = data.sort_values('play',ascending=False).head(50)

#font_path指明用什么樣的字體風格,這里用的是電腦上都有的微軟雅黑
w1 = wordcloud.WordCloud(width=1000,height=700,
                         background_color='black',
                         font_path='msyh.ttc')
txt = "\n".join(i for i in data['title'])
w1.generate(txt)
w1.to_file('F:\\詞云.png')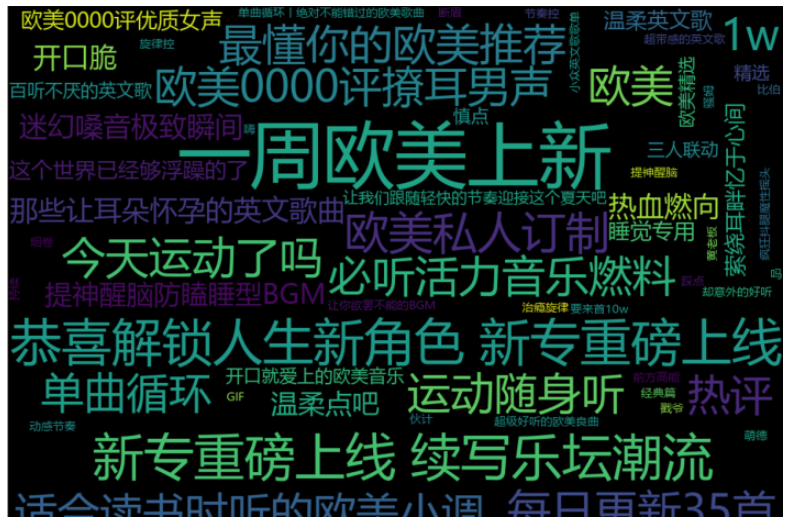
為了簡化代碼,構建了通用函數
get_matplot(x,y,chart,title,ha,size,color)
x表示充當x軸數據;
y表示充當y軸數據;
chart表示圖標類型,這里分為三種barh、hist、squarify.plot;
ha表示文本相對朝向;
size表示字體大小;
color表示圖表顏色;
def get_matplot(x,y,chart,title,ha,size,color):
    # 設置圖片顯示屬性,字體及大小
    plt.rcParams['font.sans-serif'] = ['Microsoft YaHei']
    plt.rcParams['font.size'] = size
    plt.rcParams['axes.unicode_minus'] = False
    # 設置圖片顯示屬性
    fig = plt.figure(figsize=(16, 8), dpi=80)
    ax = plt.subplot(1, 1, 1)
    ax.patch.set_color('white')
    # 設置坐標軸屬性
    lines = plt.gca()
    # 設置顯示數據
    if x ==0:
        pass
    else:
        x.reverse()
        y.reverse()
        data = pd.Series(y, index=x)
    # 設置坐標軸顏色
    lines.spines['right'].set_color('none')
    lines.spines['top'].set_color('none')
    lines.spines['left'].set_color((64/255, 64/255, 64/255))
    lines.spines['bottom'].set_color((64/255, 64/255, 64/255))
    # 設置坐標軸刻度
    lines.xaxis.set_ticks_position('none')
    lines.yaxis.set_ticks_position('none')
    if chart == 'barh':
        # 繪制柱狀圖,設置柱狀圖顏色
        data.plot.barh(ax=ax, width=0.7, alpha=0.7, color=color)
        # 添加標題,設置字體大小
        ax.set_title(f'{title}', fontsize=18, fontweight='light')
        # 添加歌曲出現次數文本
        for x, y in enumerate(data.values):
            plt.text(y+0.3, x-0.12, '%s' % y, ha=f'{ha}')
    elif chart == 'hist':
        # 繪制直方圖,設置柱狀圖顏色
        ax.hist(y, bins=30, alpha=0.7, color=(21/255, 47/255, 71/255))
        # 添加標題,設置字體大小
        ax.set_title(f'{title}', fontsize=18, fontweight='light')
    elif chart == 'plot':
        colors = ['#adb0ff', '#ffb3ff', '#90d595', '#e48381', '#aafbff', '#f7bb5f', '#eafb50',
         '#adb0ff', '#ffb3ff', '#90d595', '#e48381', '#aafbff', '#f7bb5f', '#eafb50',
         '#adb0ff', '#ffb3ff', '#90d595', '#e48381', '#aafbff', '#f7bb5f', '#eafb50',
         '#adb0ff', '#ffb3ff', '#90d595', '#e48381', '#aafbff', '#f7bb5f', '#eafb50',
         '#adb0ff', '#ffb3ff', '#90d595', '#e48381', '#aafbff', '#f7bb5f', '#eafb50',
          '#adb0ff', '#ffb3ff', '#90d595', '#e48381', '#aafbff', '#f7bb5f', '#eafb50',
          '#adb0ff', '#ffb3ff', '#90d595', '#e48381', '#aafbff']
        plot = squarify.plot(sizes=y, label=x, color=colors, alpha=1, value=y, edgecolor='white', linewidth=1.5)
        # 設置標簽大小為1
        plt.rc('font', size=6)
        # 設置標題大小
        plot.set_title(f'{title}', fontsize=13, fontweight='light')
        # 除坐標軸
        plt.axis('off')
        # 除上邊框和右邊框刻度
        plt.tick_params(top=False, right=False)
    # 顯示圖片
    plt.show()
#構建color序列
color = [(153/255, 0/255, 102/255),(8/255, 88/255, 121/255),(160/255, 102/255, 50/255),(136/255, 43/255, 48/255),(16/255, 152/255, 168/255),(153/255, 0/255, 102/255)]
關于“如何使用Python對網易云歌單數據分析及可視化”這篇文章的內容就介紹到這里,感謝各位的閱讀!相信大家對“如何使用Python對網易云歌單數據分析及可視化”知識都有一定的了解,大家如果還想學習更多知識,歡迎關注億速云行業資訊頻道。
免責聲明:本站發布的內容(圖片、視頻和文字)以原創、轉載和分享為主,文章觀點不代表本網站立場,如果涉及侵權請聯系站長郵箱:is@yisu.com進行舉報,并提供相關證據,一經查實,將立刻刪除涉嫌侵權內容。