您好,登錄后才能下訂單哦!
您好,登錄后才能下訂單哦!
這篇文章主要介紹Python中LightGBM的示例分析,文中介紹的非常詳細,具有一定的參考價值,感興趣的小伙伴們一定要看完!
LightGBM是擴展機器學習系統。是一款基于GBDT(梯度提升決策樹)算法的分布梯度提升框架。其設計思路主要集中在減少數據對內存與計算性能的使用上,以及減少多機器并行計算時的通訊代價
簡單易用。提供了主流的Python\C++\R語言接口,用戶可以輕松使用LightGBM建模并獲得相當不錯的效果。
高效可擴展。在處理大規模數據集時高效迅速、高準確度,對內存等硬件資源要求不高。
魯棒性強。相較于深度學習模型不需要精細調參便能取得近似的效果。
LightGBM直接支持缺失值與類別特征,無需對數據額外進行特殊處理
相對于深度學習模型無法對時空位置建模,不能很好地捕獲圖像、語音、文本等高維數據。
在擁有海量訓練數據,并能找到合適的深度學習模型時,深度學習的精度可以遙遙領先LightGBM。
英雄聯盟數據集 提取碼:1234
本數據用于LightGBM分類實戰。該數據集共有9881場英雄聯盟韓服鉆石段位以上的排位賽數據,數據提供了在十分鐘時的游戲狀態,包括擊殺數,金幣數量,經驗值,等級等信息。
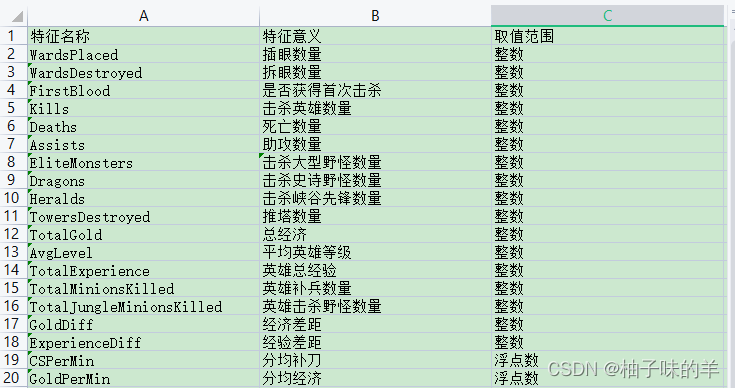
#導入基本庫
import numpy as np
import pandas as pd

## 繪圖函數庫
import matplotlib.pyplot as plt
import seaborn as sns
#%% 數據讀入:利用Pandas自帶的read_csv函數讀取并轉化為DataFrame格式
df = pd.read_csv('D:\Python\ML\data\high_diamond_ranked_10min.csv')
y = df.blueWins
#%%查看樣本數據
#print(y.value_counts())
#標注特征列
drop_cols=['gameId','blueWins']
x=df.drop(drop_cols,axis=1)
#對數字特征進行統計描述
x_des=x.describe()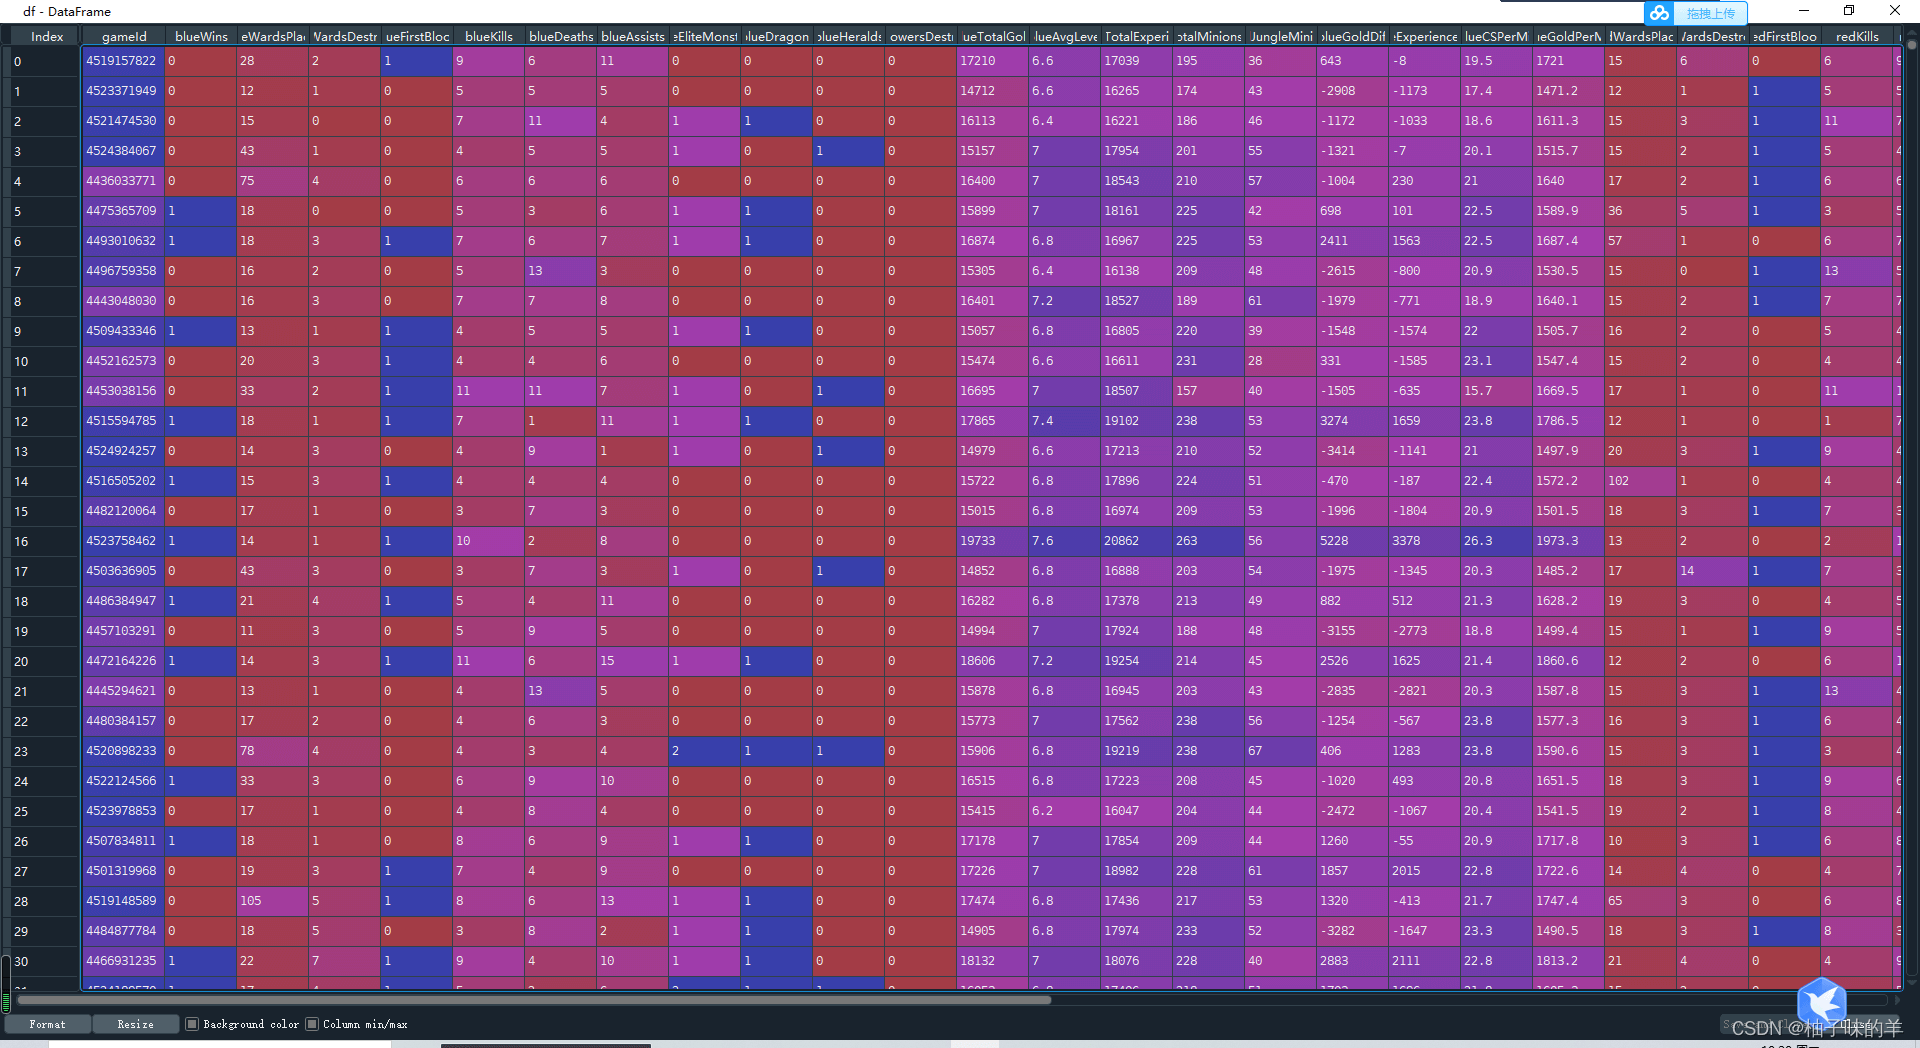

#%%去除冗余數據,因為紅藍為競爭關系,只需知道一方的情況,對方相反因此去除紅方的數據信息
drop_cols = ['redFirstBlood','redKills','redDeaths'
             ,'redGoldDiff','redExperienceDiff', 'blueCSPerMin',
            'blueGoldPerMin','redCSPerMin','redGoldPerMin']
x.drop(drop_cols, axis=1, inplace=True)
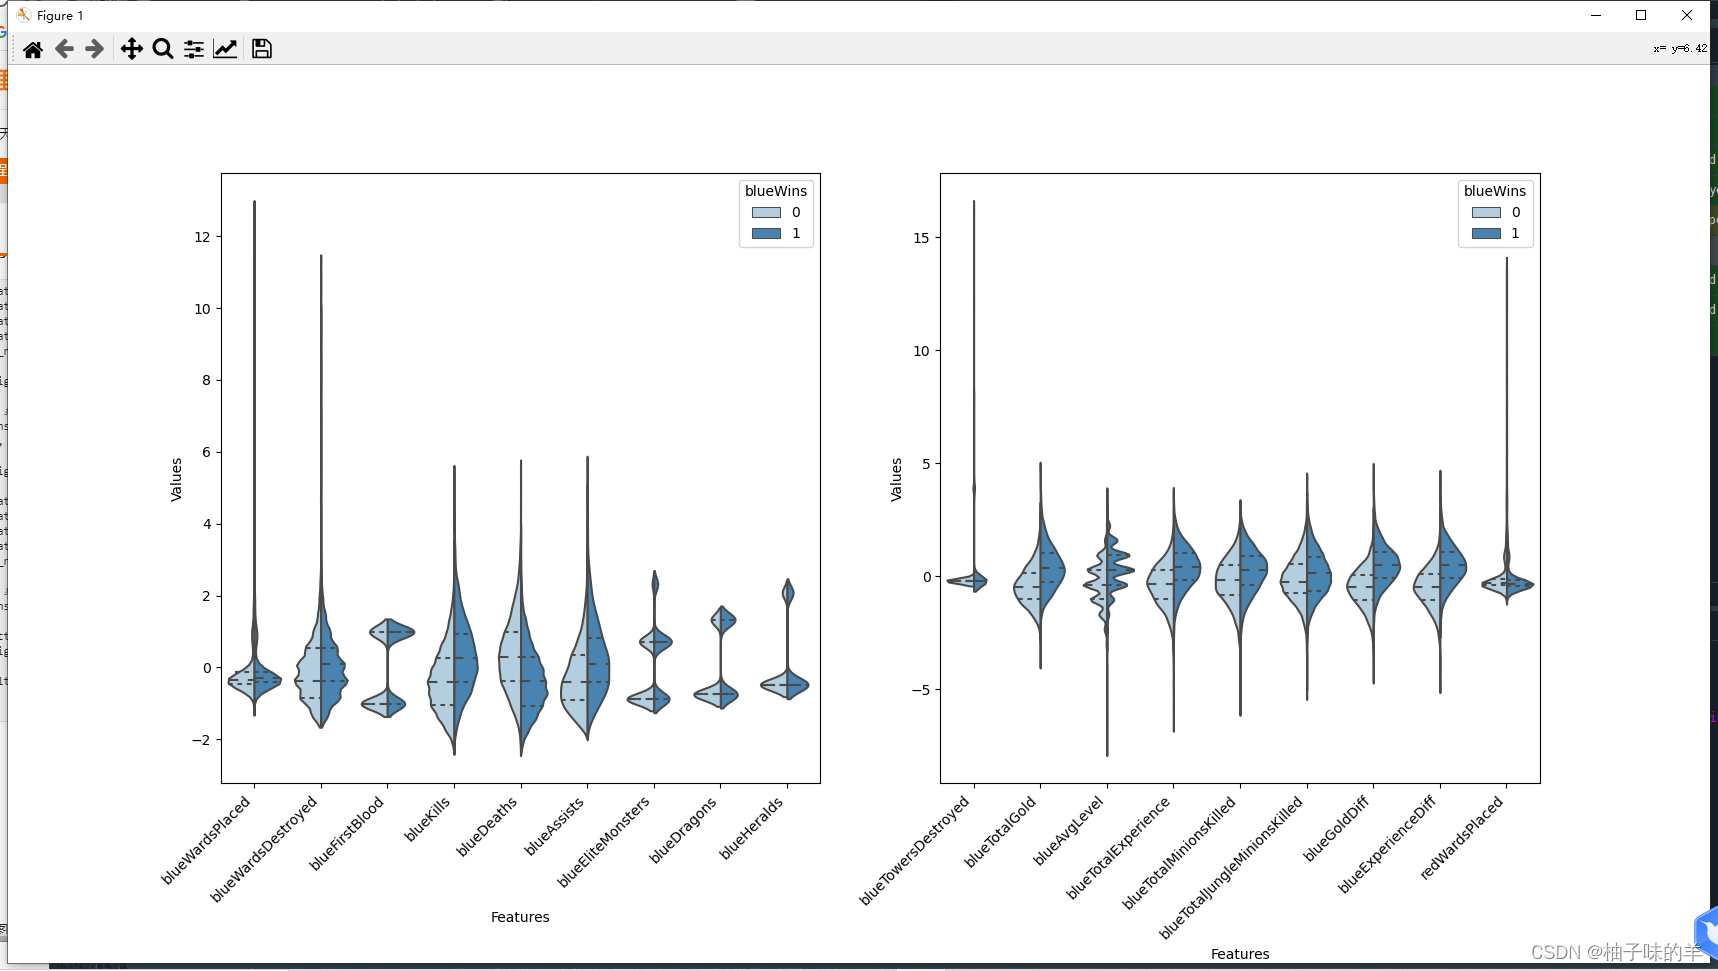
#%%可視化描述。為了有一個好的呈現方式,分兩張小提琴圖展示前九個特征和中間九個特征,后面的相同不再贅述
data = x
data_std = (data - data.mean()) / data.std()
data = pd.concat([y, data_std.iloc[:, 0:9]], axis=1)#將標簽與前九列拼接此時的到的data是(9879*10)的metric
data = pd.melt(data, id_vars='blueWins', var_name='Features', value_name='Values')#將上面的數據melt成(88911*3)的metric

fig, ax = plt.subplots(1,2,figsize=(15,8))

# 繪制小提琴圖
sns.violinplot(x='Features', y='Values', hue='blueWins', data=data, split=True,
               inner='quart', ax=ax[0], palette='Blues')
fig.autofmt_xdate(rotation=45)#改變x軸坐標的現實方法,可以斜著表示(傾斜45度),不用平著擠成一堆

data = x
data_std = (data - data.mean()) / data.std()
data = pd.concat([y, data_std.iloc[:, 9:18]], axis=1)
data = pd.melt(data, id_vars='blueWins', var_name='Features', value_name='Values')

# 繪制小提琴圖
sns.violinplot(x='Features', y='Values', hue='blueWins',
               data=data, split=True, inner='quart', ax=ax[1], palette='Blues')
fig.autofmt_xdate(rotation=45)
plt.show()
#%%畫出各個特征之間的相關性熱力圖
fig,ax=plt.subplots(figsize=(15,18))
sns.heatmap(round(x.corr(),2),cmap='Blues',annot=True)
fig.autofmt_xdate(rotation=45)
plt.show()
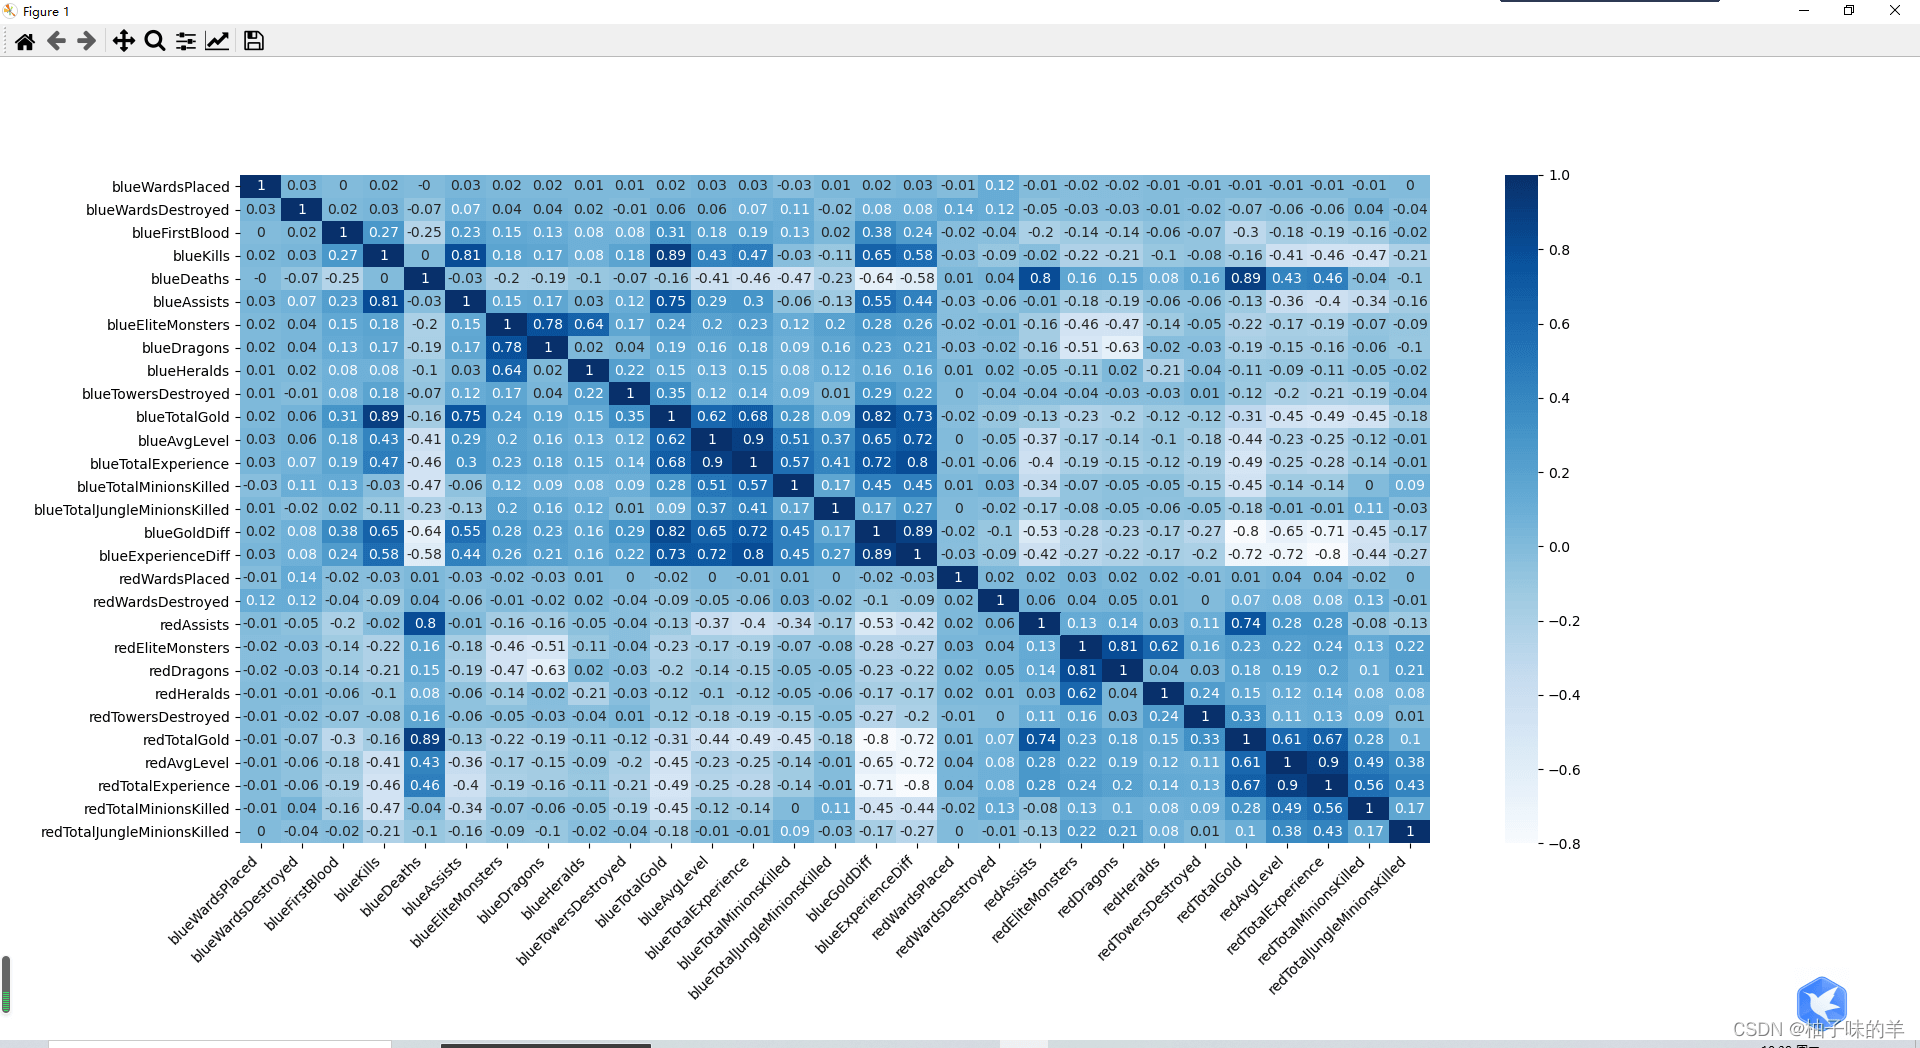
#%%根據上述特征圖,剔除相關性較強的冗余特征(redAvgLevel,blueAvgLevel)
# 去除冗余特征
drop_cols = ['redAvgLevel','blueAvgLevel']
x.drop(drop_cols, axis=1, inplace=True)

sns.set(style='whitegrid', palette='muted')

# 構造兩個新特征
x['wardsPlacedDiff'] = x['blueWardsPlaced'] - x['redWardsPlaced']
x['wardsDestroyedDiff'] = x['blueWardsDestroyed'] - x['redWardsDestroyed']

data = x[['blueWardsPlaced','blueWardsDestroyed','wardsPlacedDiff','wardsDestroyedDiff']].sample(1000)
data_std = (data - data.mean()) / data.std()
data = pd.concat([y, data_std], axis=1)
data = pd.melt(data, id_vars='blueWins', var_name='Features', value_name='Values')

plt.figure(figsize=(15,8))
sns.swarmplot(x='Features', y='Values', hue='blueWins', data=data)
plt.show()
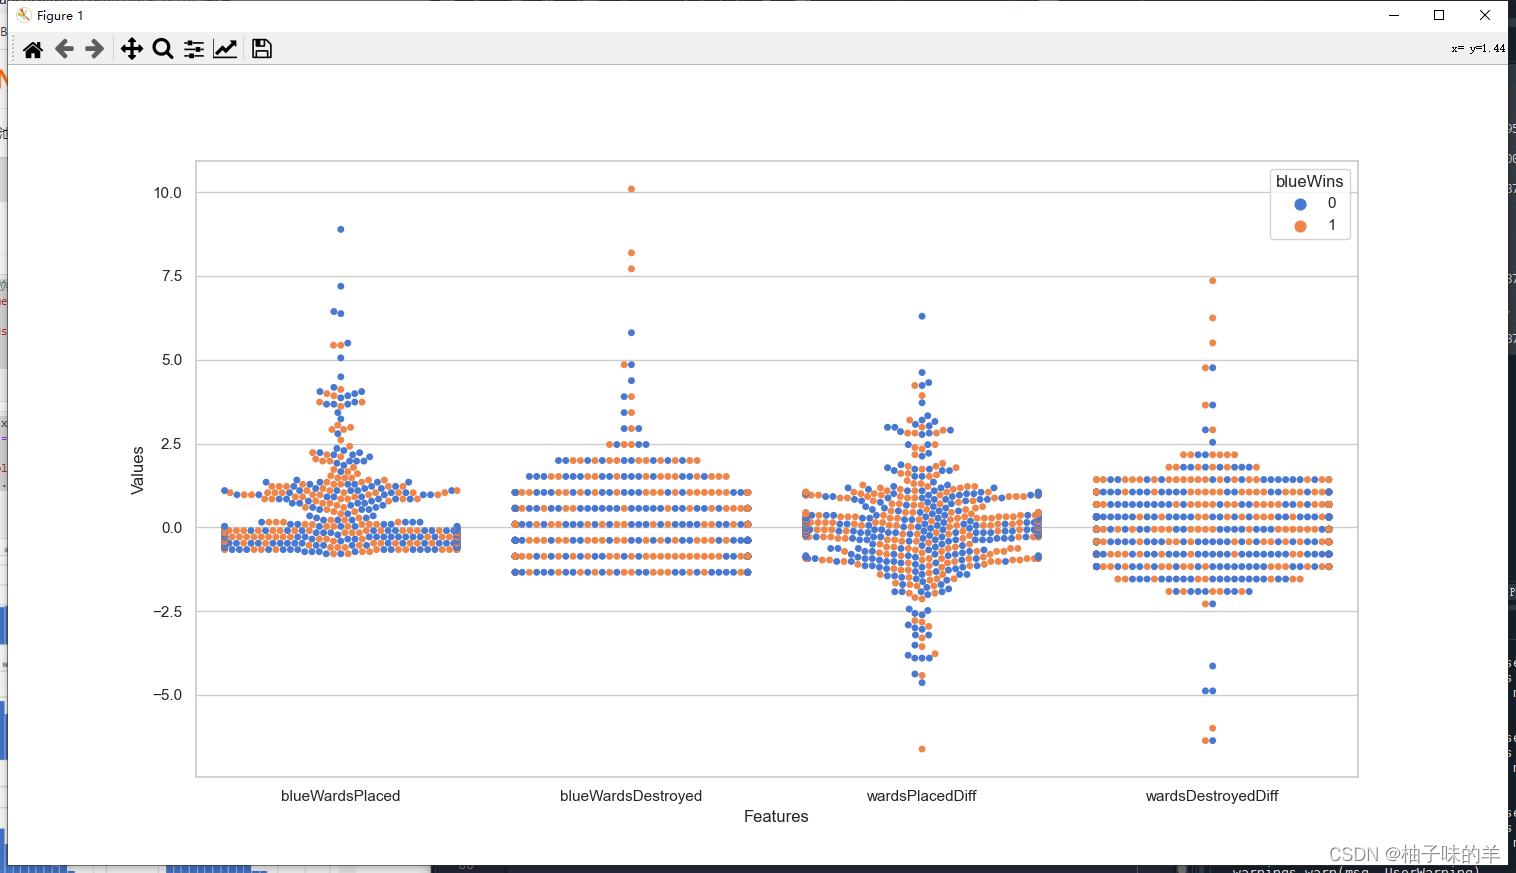
#%%由上圖插眼數量的離散圖,可以發現插眼數量與游戲勝負之間的顯著規律,游戲前十分鐘插眼與否對最終的勝負影響不大,故將這些特征去除
## 去除和眼位相關的特征
drop_cols = ['blueWardsPlaced','blueWardsDestroyed','wardsPlacedDiff',
            'wardsDestroyedDiff','redWardsPlaced','redWardsDestroyed']
x.drop(drop_cols, axis=1, inplace=True)
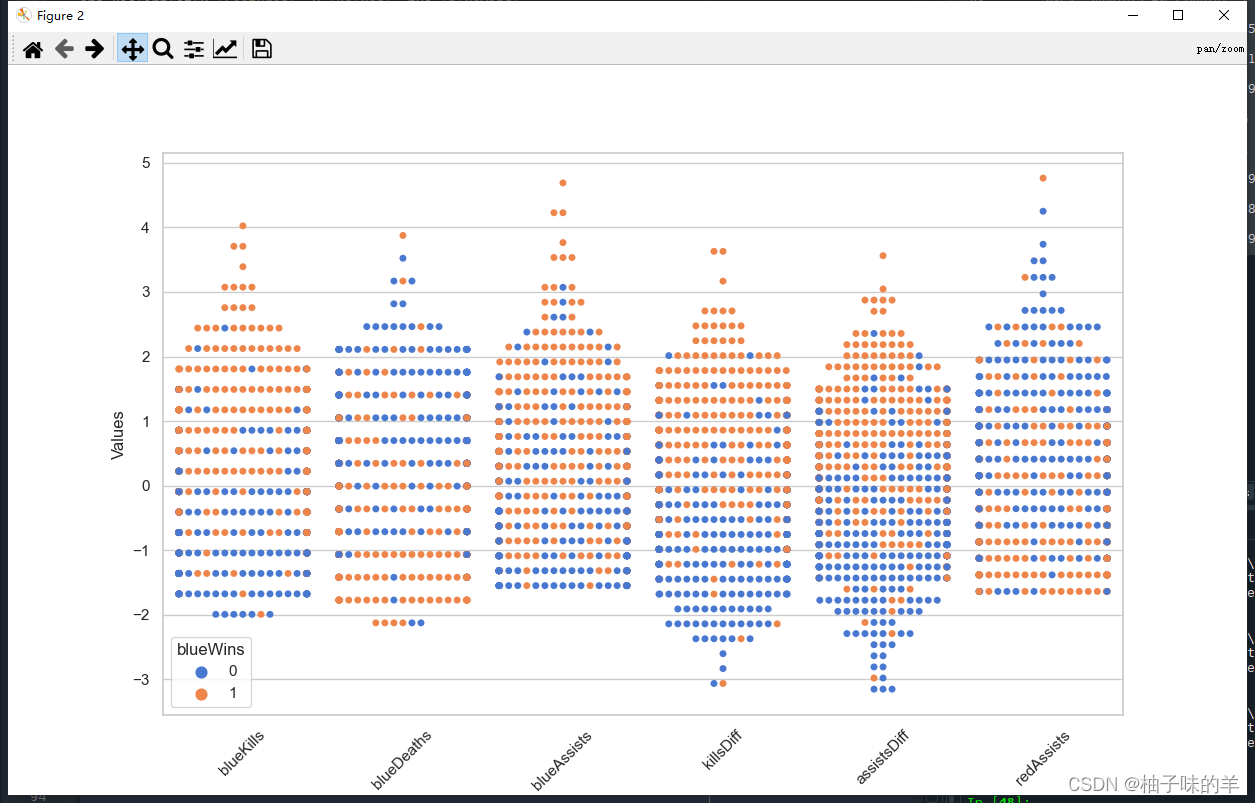
#%%擊殺、死亡與助攻數的數據分布差別不大,但是擊殺減去死亡、助攻減去死亡的分布與緣分不差別較大,構造兩個新的特征
x['killsDiff'] = x['blueKills'] - x['blueDeaths']
x['assistsDiff'] = x['blueAssists'] - x['redAssists']
x[['blueKills','blueDeaths','blueAssists','killsDiff','assistsDiff','redAssists']].hist(figsize=(15,8), bins=20)
plt.show()

#%%
data = x[['blueKills','blueDeaths','blueAssists','killsDiff','assistsDiff','redAssists']].sample(1000)
data_std = (data - data.mean()) / data.std()
data = pd.concat([y, data_std], axis=1)
data = pd.melt(data, id_vars='blueWins', var_name='Features', value_name='Values')

plt.figure(figsize=(10,6))
sns.swarmplot(x='Features', y='Values', hue='blueWins', data=data)
plt.xticks(rotation=45)
plt.show()
#%%
data = pd.concat([y, x], axis=1).sample(500)
sns.pairplot(data, vars=['blueKills','blueDeaths','blueAssists','killsDiff','assistsDiff','redAssists'],
             hue='blueWins')
plt.show()

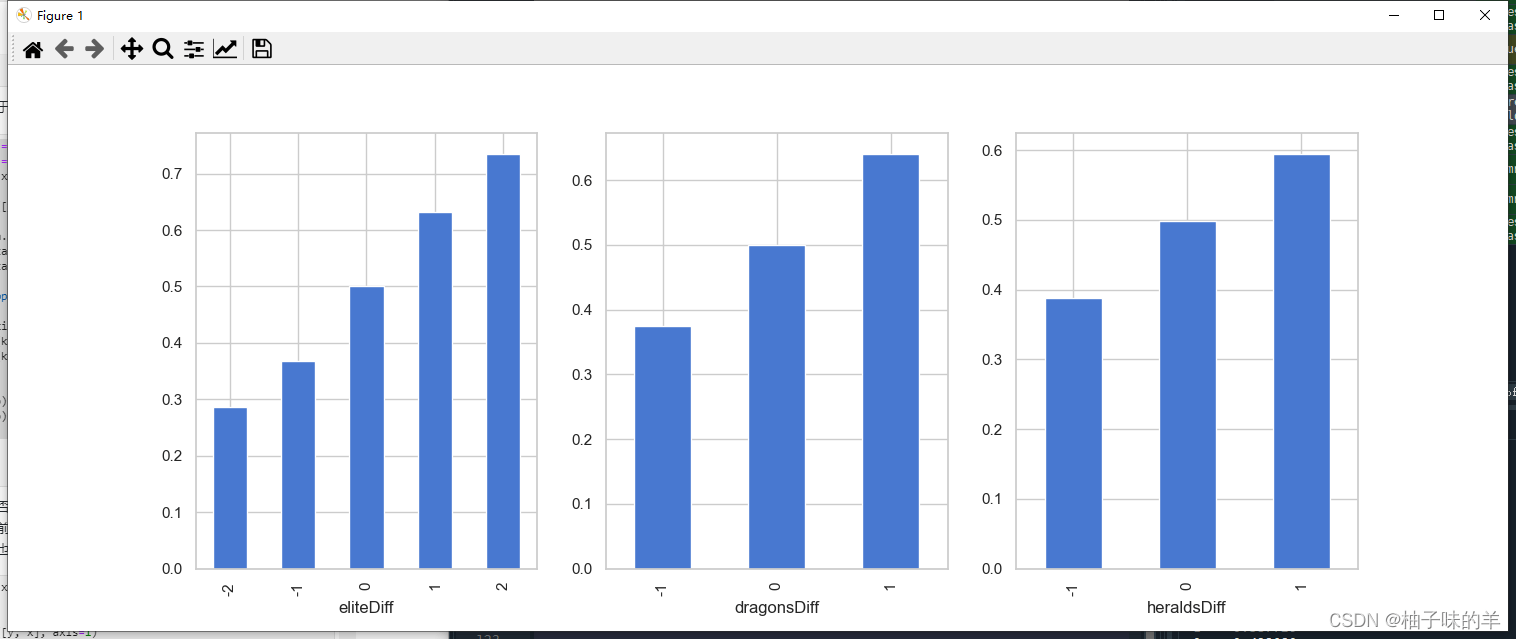
#%%一些特征兩兩組合后對于數據的劃分有提升
x['dragonsDiff'] = x['blueDragons'] - x['redDragons']#拿到龍
x['heraldsDiff'] = x['blueHeralds'] - x['redHeralds']#拿到峽谷先鋒
x['eliteDiff'] = x['blueEliteMonsters'] - x['redEliteMonsters']#擊殺大型野怪
data = pd.concat([y, x], axis=1)
eliteGroup = data.groupby(['eliteDiff'])['blueWins'].mean()
dragonGroup = data.groupby(['dragonsDiff'])['blueWins'].mean()
heraldGroup = data.groupby(['heraldsDiff'])['blueWins'].mean()
fig, ax = plt.subplots(1,3, figsize=(15,4))

eliteGroup.plot(kind='bar', ax=ax[0])
dragonGroup.plot(kind='bar', ax=ax[1])
heraldGroup.plot(kind='bar', ax=ax[2])

print(eliteGroup)
print(dragonGroup)
print(heraldGroup)

plt.show()
#%%推塔數量與游戲勝負
x['towerDiff'] = x['blueTowersDestroyed'] - x['redTowersDestroyed']
data = pd.concat([y, x], axis=1)
towerGroup = data.groupby(['towerDiff'])['blueWins']
print(towerGroup.count())
print(towerGroup.mean())

fig, ax = plt.subplots(1,2,figsize=(15,5))

towerGroup.mean().plot(kind='line', ax=ax[0])
ax[0].set_title('Proportion of Blue Wins')
ax[0].set_ylabel('Proportion')

towerGroup.count().plot(kind='line', ax=ax[1])
ax[1].set_title('Count of Towers Destroyed')
ax[1].set_ylabel('Count')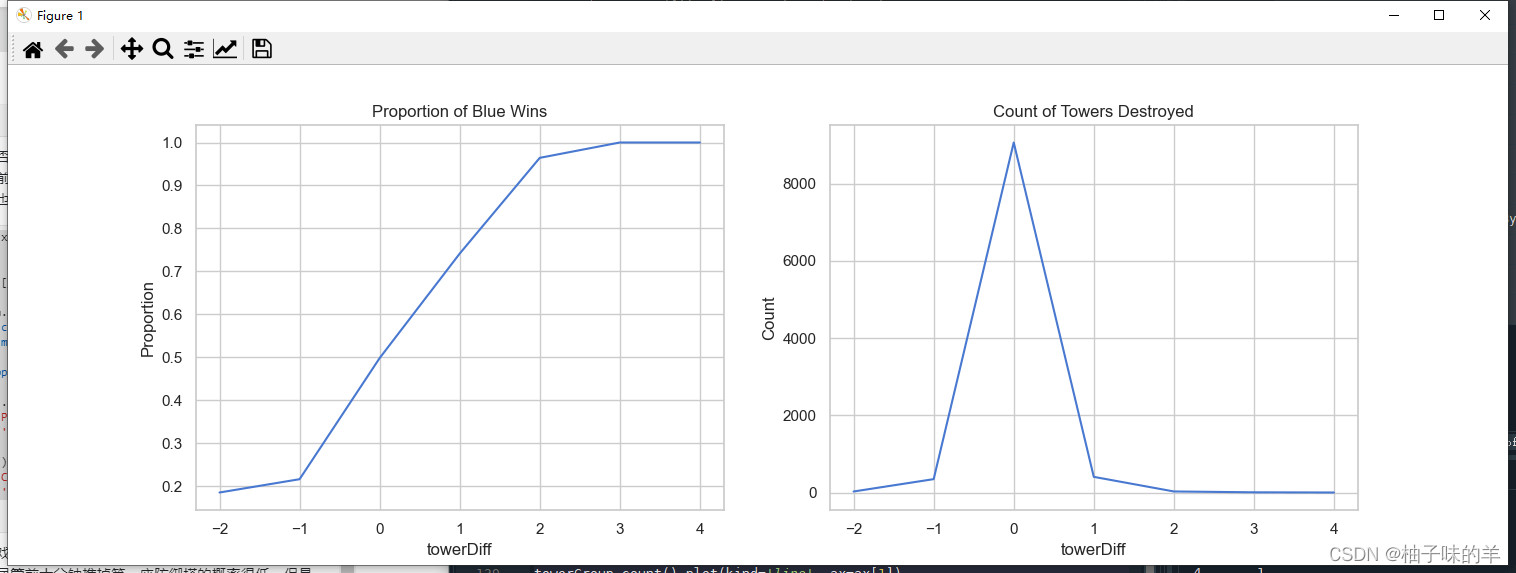
#%%利用LightGBM進行訓練和預測
## 為了正確評估模型性能,將數據劃分為訓練集和測試集,并在訓練集上訓練模型,在測試集上驗證模型性能。
from sklearn.model_selection import train_test_split
## 選擇其類別為0和1的樣本 (不包括類別為2的樣本)
data_target_part = y
data_features_part = x
## 測試集大小為20%, 80%/20%分
x_train, x_test, y_train, y_test = train_test_split(data_features_part, data_target_part, test_size = 0.2, random_state = 2020)
#%%## 導入LightGBM模型
from lightgbm.sklearn import LGBMClassifier
## 定義 LightGBM 模型
clf = LGBMClassifier()
# 在訓練集上訓練LightGBM模型
clf.fit(x_train, y_train)

#%%在訓練集和測試集上分別利用訓練好的模型進行預測
train_predict = clf.predict(x_train)
test_predict = clf.predict(x_test)
from sklearn import metrics

## 利用accuracy(準確度)【預測正確的樣本數目占總預測樣本數目的比例】評估模型效果
print('The accuracy of the LightGBM is:',metrics.accuracy_score(y_train,train_predict))
print('The accuracy of the LightGBM is:',metrics.accuracy_score(y_test,test_predict))

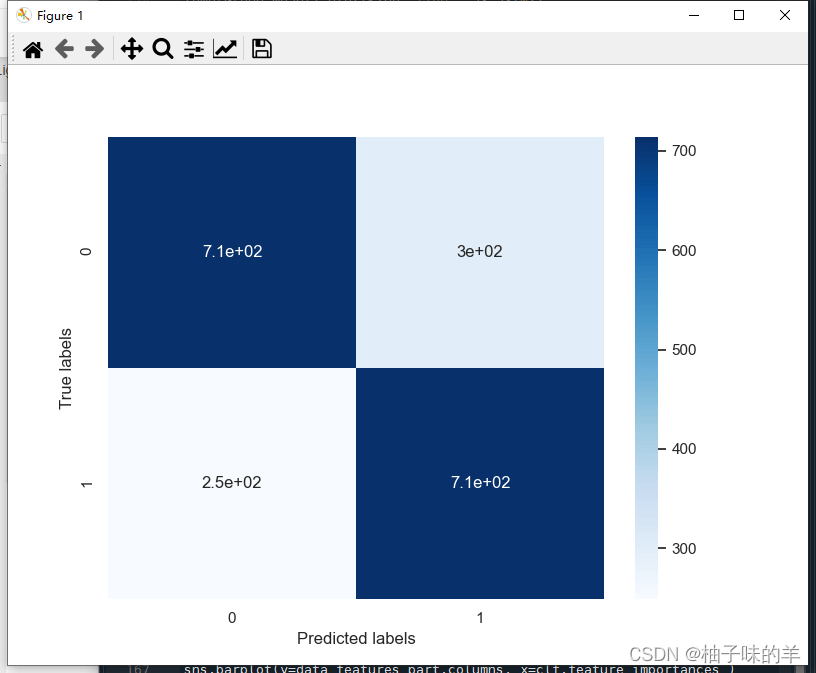
## 查看混淆矩陣 (預測值和真實值的各類情況統計矩陣)
confusion_matrix_result = metrics.confusion_matrix(test_predict,y_test)
print('The confusion matrix result:\n',confusion_matrix_result)

# 利用熱力圖對于結果進行可視化
plt.figure(figsize=(8, 6))
sns.heatmap(confusion_matrix_result, annot=True, cmap='Blues')
plt.xlabel('Predicted labels')
plt.ylabel('True labels')
plt.show()
#%%利用lightgbm進行特征選擇,同樣可以用屬性feature_importances_查看特征的重要度
sns.barplot(y=data_features_part.columns, x=clf.feature_importances_)

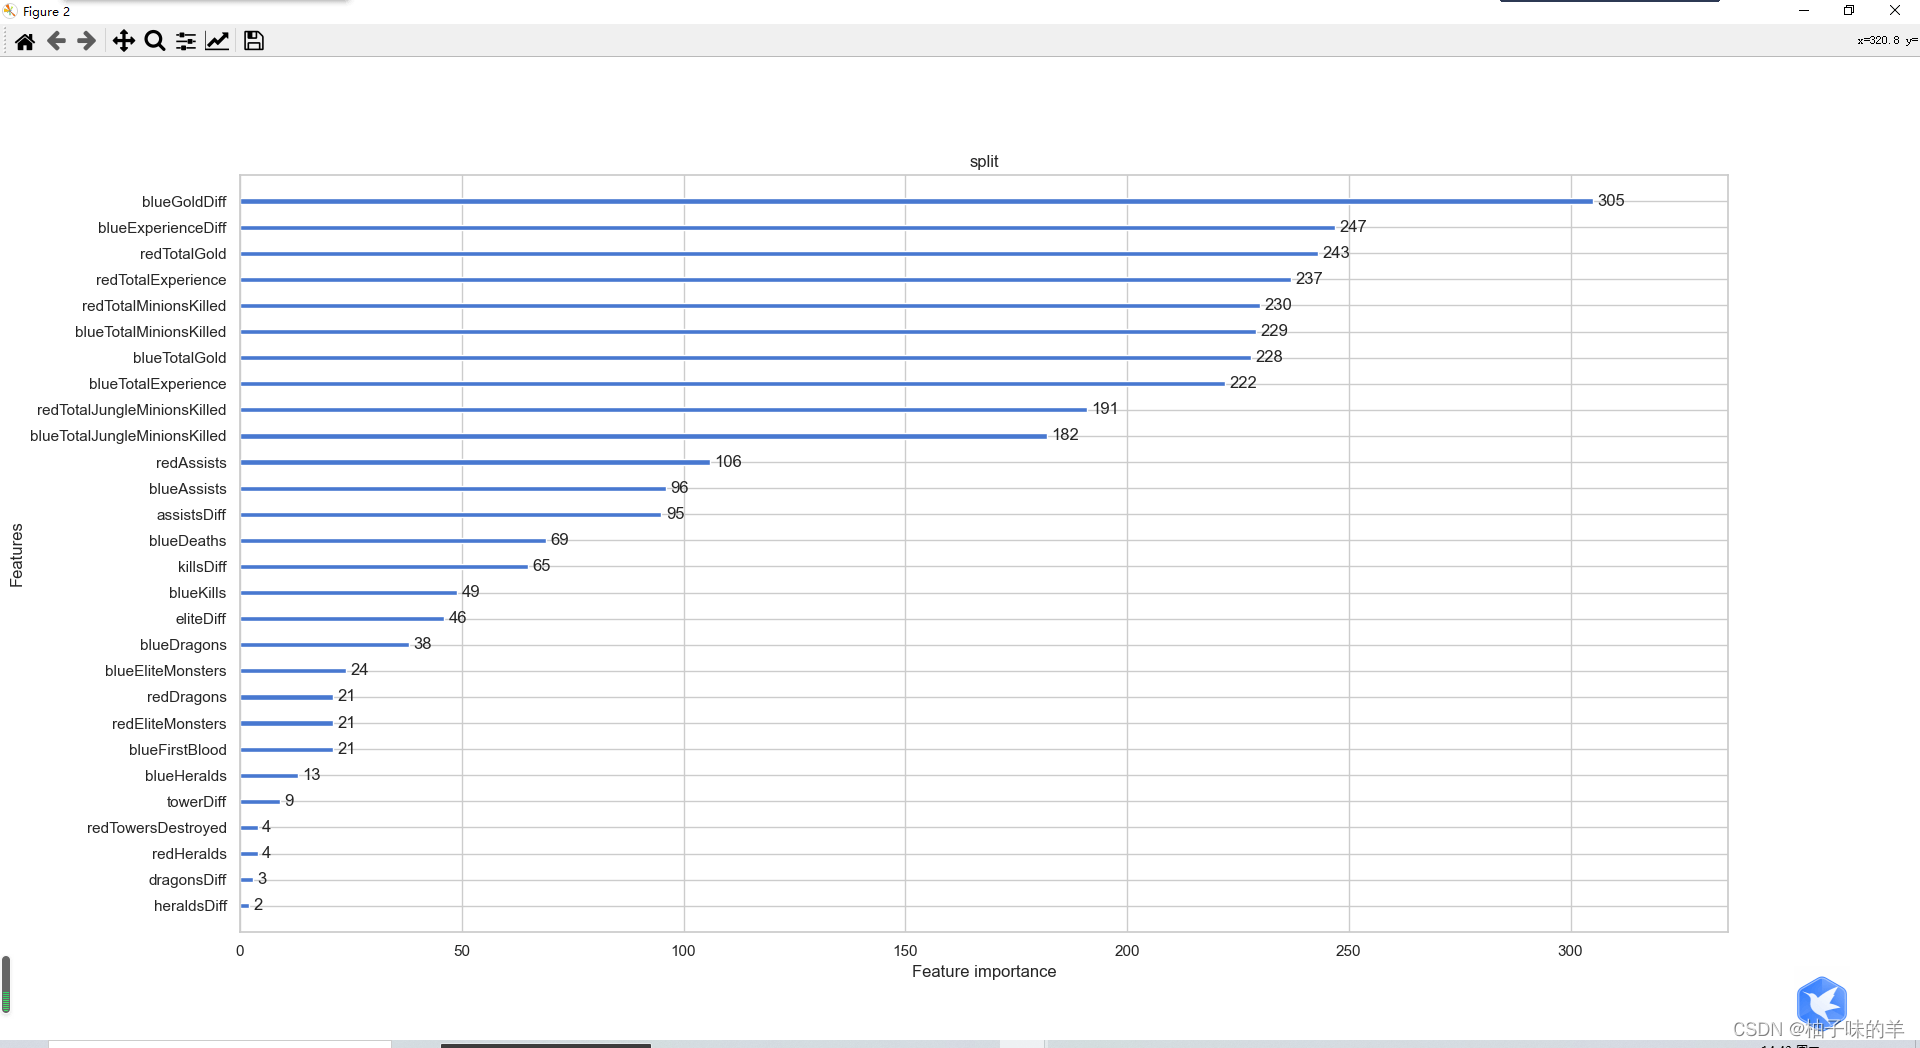
#%%除feature_importances_外,還可以使用LightGBM中的其他屬性進行評估(gain,split)
from sklearn.metrics import accuracy_score
from lightgbm import plot_importance

def estimate(model,data):
    ax1=plot_importance(model,importance_type="gain")
    ax1.set_title('gain')
    ax2=plot_importance(model, importance_type="split")
    ax2.set_title('split')
    plt.show()
def classes(data,label,test):
    model=LGBMClassifier()
    model.fit(data,label)
    ans=model.predict(test)
    estimate(model, data)
    return ans

ans=classes(x_train,y_train,x_test)
pre=accuracy_score(y_test, ans)
print('acc=',accuracy_score(y_test,ans))
通過調整參數獲得更好的效果: LightGBM中重要的參數
learning_rate: 有時也叫作eta,系統默認值為0.3。每一步迭代的步長,很重要。太大了運行準確率不高,太小了運行速度慢。
num_leaves:系統默認為32。這個參數控制每棵樹中最大葉子節點數量。
feature_fraction:系統默認值為1。我們一般設置成0.8左右。用來控制每棵隨機采樣的列數的占比(每一列是一個特征)。
max_depth: 系統默認值為6,我們常用3-10之間的數字。這個值為樹的最大深度。這個值是用來控制過擬合的。max_depth越大,模型學習的更加具體。
#%%調整參數,獲得更好的效果
## 從sklearn庫中導入網格調參函數
from sklearn.model_selection import GridSearchCV

## 定義參數取值范圍
learning_rate = [0.1, 0.3, 0.6]
feature_fraction = [0.5, 0.8, 1]
num_leaves = [16, 32, 64]
max_depth = [-1,3,5,8]

parameters = { 'learning_rate': learning_rate,
              'feature_fraction':feature_fraction,
              'num_leaves': num_leaves,
              'max_depth': max_depth}
model = LGBMClassifier(n_estimators = 50)

## 進行網格搜索
clf = GridSearchCV(model, parameters, cv=3, scoring='accuracy',verbose=3, n_jobs=-1)
clf = clf.fit(x_train, y_train)
#%%查看最好的參數值分別是多少
print(clf.best_params_)
#%%查看最好的參數值分別是多少
print(clf.best_params_)
#%% 在訓練集和測試集上分布利用最好的模型參數進行預測
## 定義帶參數的 LightGBM模型
clf = LGBMClassifier(feature_fraction = 1,
                    learning_rate = 0.1,
                    max_depth= 3,
                    num_leaves = 16)
# 在訓練集上訓練LightGBM模型
clf.fit(x_train, y_train)

train_predict = clf.predict(x_train)
test_predict = clf.predict(x_test)

## 利用accuracy(準確度)【預測正確的樣本數目占總預測樣本數目的比例】評估模型效果
print('The accuracy of the LightGBM is:',metrics.accuracy_score(y_train,train_predict))
print('The accuracy of the LightGBM is:',metrics.accuracy_score(y_test,test_predict))

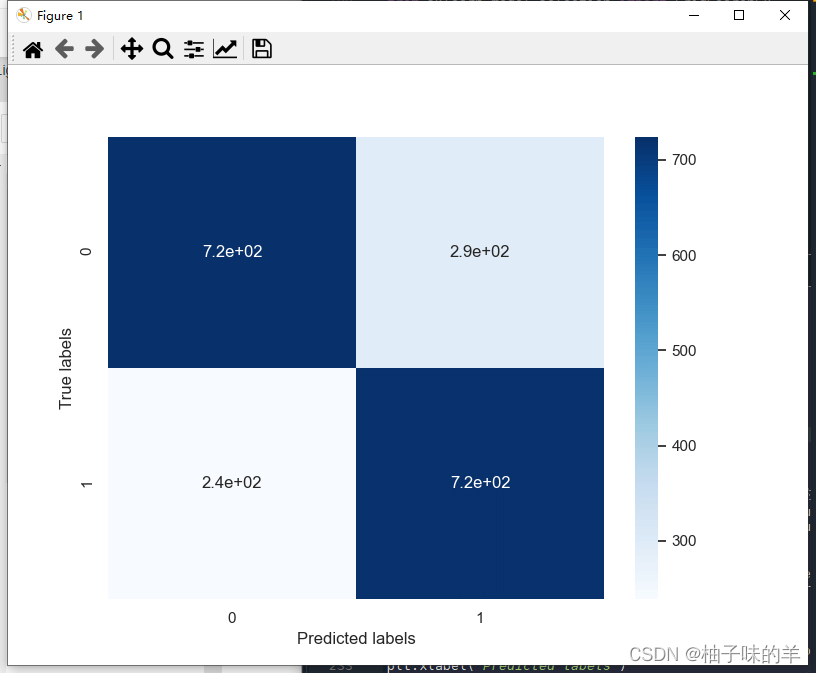
## 查看混淆矩陣 (預測值和真實值的各類情況統計矩陣)
confusion_matrix_result = metrics.confusion_matrix(test_predict,y_test)
print('The confusion matrix result:\n',confusion_matrix_result)

# 利用熱力圖對于結果進行可視化
plt.figure(figsize=(8, 6))
sns.heatmap(confusion_matrix_result, annot=True, cmap='Blues')
plt.xlabel('Predicted labels')
plt.ylabel('True labels')
plt.show()
num_leaves參數 這是控制樹模型復雜度的主要參數,一般的我們會使num_leaves小于(2的max_depth次方),以防止過擬合。由于LightGBM是leaf-wise建樹與XGBoost的depth-wise建樹方法不同,num_leaves比depth有更大的作用。
min_data_in_leaf 這是處理過擬合問題中一個非常重要的參數. 它的值取決于訓練數據的樣本個樹和 num_leaves參數. 將其設置的較大可以避免生成一個過深的樹, 但有可能導致欠擬合. 實際應用中, 對于大數據集, 設置其為幾百或幾千就足夠了.
max_depth 樹的深度,depth 的概念在 leaf-wise 樹中并沒有多大作用, 因為并不存在一個從 leaves 到 depth 的合理映射
通過設置 bagging_fraction 和 bagging_freq 參數來使用 bagging 方法。
通過設置 feature_fraction 參數來使用特征的子抽樣。
選擇較小的 max_bin 參數。使用 save_binary 在未來的學習過程對數據加載進行加速。
使用較大的 max_bin (學習速度可能變慢)
使用較小的 learning_rate 和較大的 num_iterations
使用較大的 num_leaves (可能導致過擬合)
使用更大的訓練數據
嘗試 dart 模式
使用較小的 max_bin
使用較小的 num_leaves
使用 min_data_in_leaf 和 min_sum_hessian_in_leaf
通過設置 bagging_fraction 和 bagging_freq 來使用 bagging
通過設置 feature_fraction 來使用特征子抽樣
使用更大的訓練數據
使用 lambda_l1, lambda_l2 和 min_gain_to_split 來使用正則
嘗試 max_depth 來避免生成過深的樹
以上是“Python中LightGBM的示例分析”這篇文章的所有內容,感謝各位的閱讀!希望分享的內容對大家有幫助,更多相關知識,歡迎關注億速云行業資訊頻道!
免責聲明:本站發布的內容(圖片、視頻和文字)以原創、轉載和分享為主,文章觀點不代表本網站立場,如果涉及侵權請聯系站長郵箱:is@yisu.com進行舉報,并提供相關證據,一經查實,將立刻刪除涉嫌侵權內容。