您好,登錄后才能下訂單哦!
您好,登錄后才能下訂單哦!
這篇文章主要介紹 Python matplotlib Line2D對象怎么用,文中介紹的非常詳細,具有一定的參考價值,感興趣的小伙伴們一定要看完!
matplotlib.pyplot很像MATLAB。它的每一個函數都會對現有的圖形進行更改:比如建立一個圖形(figure),創建畫圖區域,在畫圖區域做出線條,使用標簽裝飾。
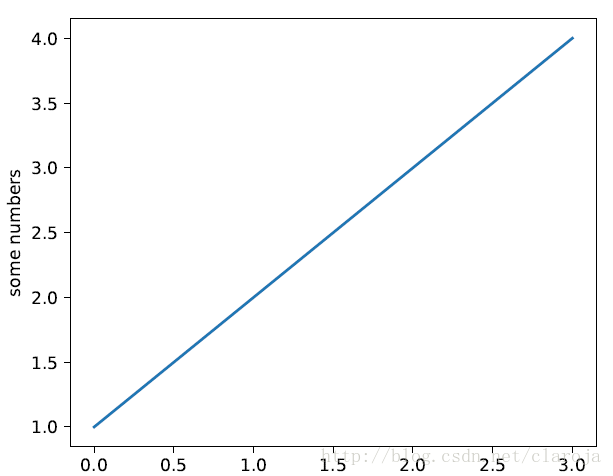
如果你傳入了一個簡單的list或者array,matplotlib會把它當成y值,并自動生成x值。事實上所有序列都會被轉換為numpy arrays。
import matplotlib.pyplot as plt
plt.plot([1,2,3,4])
plt.ylabel('some numbers')
plt.show()
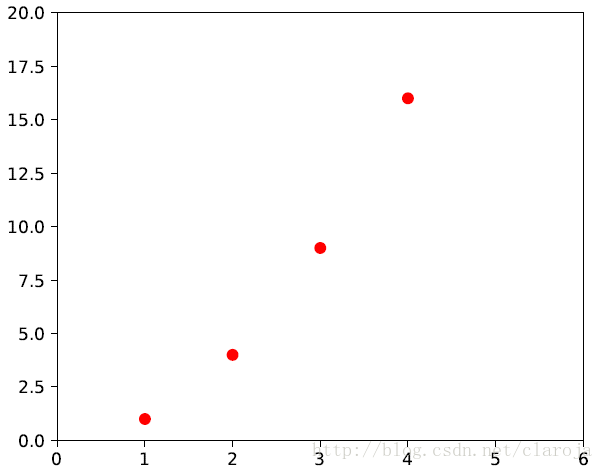
當你傳入兩個list或者array時,第一個會被當成x值,第二個會被當成y值,而且你可以通過第三個參數設置顯示的形狀和顏色(這是一個組合),當然你也可以分別設置形狀和顏色。通過plt.axis(xmin, xmax, ymin, ymax)函數你可以設置x軸,y軸的最大值和最小值:
import matplotlib.pyplot as plt
plt.plot([1,2,3,4], [1,4,9,16], 'ro')
plt.axis([0, 6, 0, 20])
plt.show()

Bases: matplotlib.artist.Artistclass matplotlib.lines.Line2D(xdata, ydata, linewidth=None, linestyle=None, color=None, marker=None, markersize=None, markeredgewidth=None, markeredgecolor=None, markerfacecolor=None, markerfacecoloralt='none', fillstyle=None, antialiased=None, dash_capstyle=None, solid_capstyle=None, dash_joinstyle=None, solid_joinstyle=None, pickradius=5, drawstyle=None, markevery=None, **kwargs)
有三種方式設置線的屬性
1)直接在plot()函數中設置
plt.plot(x, y, linewidth=2.0)
2)通過獲得線對象,對線對象進行設置
line, = plt.plot(x, y, '-')line.set_antialiased(False) # turn off antialising
3)獲得線屬性,使用setp()函數設置
lines = plt.plot(x1, y1, x2, y2)# use keyword argsplt.setp(lines, color='r', linewidth=2.0)
| Property | Value Type |
|---|---|
| alpha | float |
| animated | [True False] |
| antialiased or aa | [True False] |
| clip_box | a matplotlib.transform.Bbox instance |
| clip_on | [True False] |
| clip_path | a Path instance and a Transform instance, a Patch |
| color or c | any matplotlib color |
| contains | the hit testing function |
| dash_capstyle | [‘butt’ ‘round’ ‘projecting’] |
| dash_joinstyle | [‘miter’ ‘round’ ‘bevel’] |
| dashes | sequence of on/off ink in points |
| data | (np.array xdata, np.array ydata) |
| figure | a matplotlib.figure.Figure instance |
| label | any string |
| linestyle or ls | [‘-’ ‘–’ ‘-.’ ‘:’ ‘steps’ …] |
| linewidth or lw | float value in points |
| lod | [True False] |
| marker | [‘+’ ‘,’ ‘.’ ‘1’ ‘2’ ‘3’ ‘4’] |
| markeredgecolor or mec | any matplotlib color |
| markeredgewidth or mew | float value in points |
| markerfacecolor or mfc | any matplotlib color |
| markersize or ms | float |
| markevery | [ None integer (startind, stride) ] |
| picker | used in interactive line selection |
| pickradius | the line pick selection radius |
| solid_capstyle | [‘butt’ ‘round’ ‘projecting’] |
| solid_joinstyle | [‘miter’ ‘round’ ‘bevel’] |
| transform | a matplotlib.transforms.Transform instance |
| visible | [True False] |
| xdata | np.array |
| ydata | np.array |
| zorder | any number |
| linestyle | description |
|---|---|
| ‘-‘?or?’solid’ | solid line |
| ‘–’?or?’dashed’ | dashed line |
| ‘-.’?or?’dashdot’ | dash-dotted line |
| ‘:’?or?’dotted’ | dotted line |
| ‘None’ | draw nothing |
| ‘?’ | draw nothing |
| ” | draw nothing |
| marker | description |
|---|---|
| “.” | point |
| “,” | pixel |
| “o” | circle |
| “v” | triangle_down |
| “^” | triangle_up |
| “<” | triangle_left |
| “>” | triangle_right |
| “1” | tri_down |
| “2” | tri_up |
| “3” | tri_left |
| “4” | tri_right |
| “8” | octagon |
| “s” | square |
| “p” | pentagon |
| “P” | plus (filled) |
| “*” | star |
| “h” | hexagon1 |
| “H” | hexagon2 |
| “+” | plus |
| “x” | x |
| “X” | x (filled) |
| “D” | diamond |
| “d” | thin_diamond |
| “ | “ |
| “_” | hline |
| TICKLEFT | tickleft |
| TICKRIGHT | tickright |
| TICKUP | tickup |
| TICKDOWN | tickdown |
| CARETLEFT | caretleft (centered at tip) |
| CARETRIGHT | caretright (centered at tip) |
| CARETUP | caretup (centered at tip) |
| CARETDOWN | caretdown (centered at tip) |
| CARETLEFTBASE | caretleft (centered at base) |
| CARETRIGHTBASE | caretright (centered at base) |
| CARETUPBASE | caretup (centered at base) |
| “None”,?”?”?or?”“ | nothing |
| ‘ ... ’ | render the string using mathtext. |
| verts | a list of (x, y) pairs used for Path vertices. The center of the marker is located at (0,0) and the size is normalized. |
| path | a?Path?instance. |
以上是“ Python matplotlib Line2D對象怎么用”這篇文章的所有內容,感謝各位的閱讀!希望分享的內容對大家有幫助,更多相關知識,歡迎關注億速云行業資訊頻道!
免責聲明:本站發布的內容(圖片、視頻和文字)以原創、轉載和分享為主,文章觀點不代表本網站立場,如果涉及侵權請聯系站長郵箱:is@yisu.com進行舉報,并提供相關證據,一經查實,將立刻刪除涉嫌侵權內容。