您好,登錄后才能下訂單哦!
您好,登錄后才能下訂單哦!
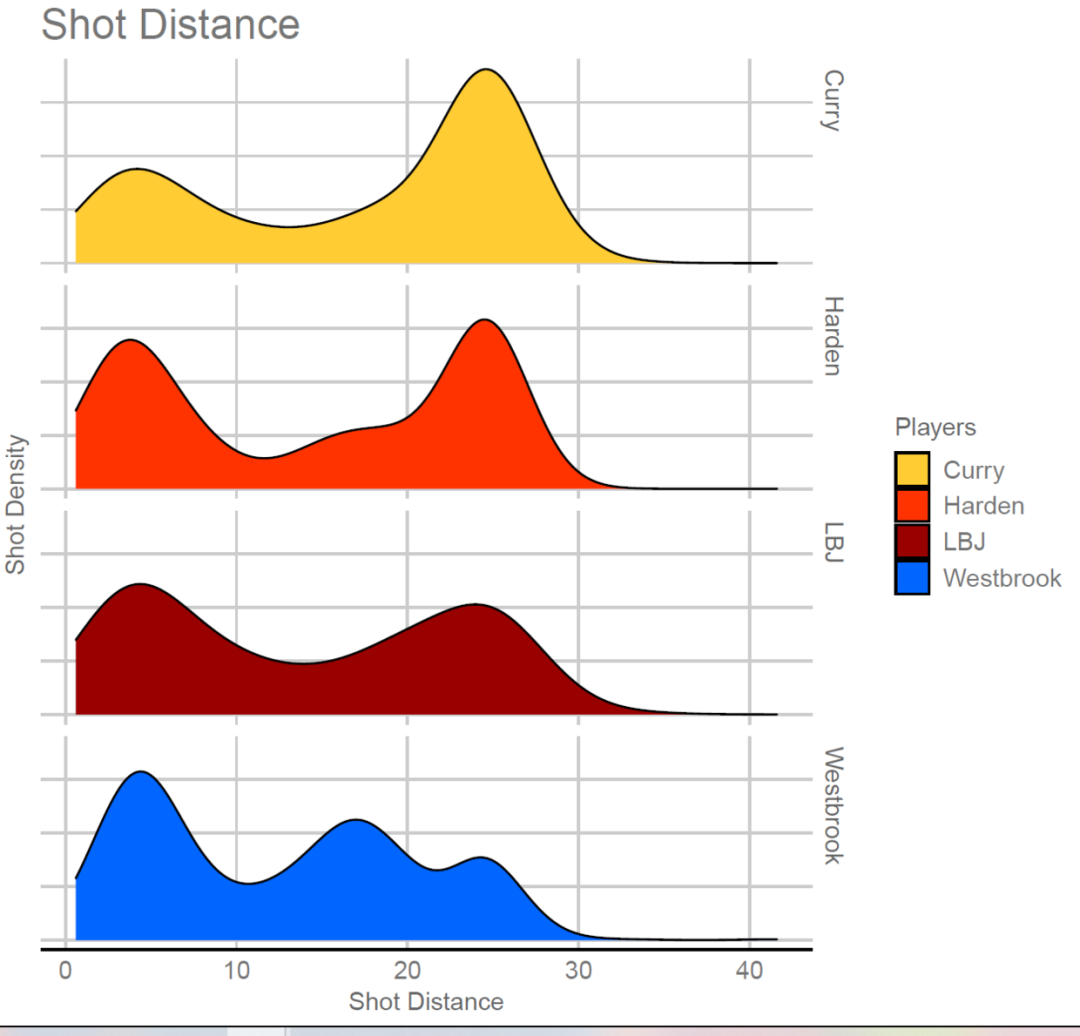
這篇文章給大家介紹怎樣使用R語言ggplot2畫山脊圖展示NBA球員出手距離的分布,內容非常詳細,感興趣的小伙伴們可以參考借鑒,希望對大家能有所幫助。
主要內容是探索了NBA 14/15賽季常規賽MVP排行榜前四名 庫里 哈登 詹姆斯 威少的投籃數據。今天重復第一個內容:用R語言的ggplot2畫山脊圖展示以上四人的投籃出手距離的分布。
原始數據集下載自kaggle
https://www.kaggle.com/dansbecker/nba-shot-logs
對原始數據集進行清洗的代碼 https://github.com/nycdatasci/bootcamp007_project/tree/master/Project1-ExploreVis/Xinyuan_Wu
這部分代碼我們就不關注了,直接運行得到作圖的數據 數據清洗的代碼我已經運行好了,需要本文的示例數據可以直接留言
df<-read.csv("NBA_MVP-1.tsv",header=T,sep="\t")
這邊遇到一個問題是:如果用read.table()函數讀入數據
read.table("NBA_MVP-1.tsv",header=T,sep="\t")就會報錯Error in scan(file = file, what = what, sep = sep, quote = quote, dec = dec, : line 145 did not have 21 elements這個是什么原因呢?暫時還沒有搞懂
library(ggplot2)
library(ggthemes)
ggplot(data=df,aes(x=dist_cut))+
  geom_density(aes(fill=player_name))+
  facet_grid(player_name~.)+
  theme_gdocs()+
  theme(axis.text.y = element_blank())+
  labs(x="Shot Distance",y="Shot Density")+
  ggtitle("Shot Distance")+
  scale_fill_manual("Players",
                    values = c("#FFCC33", "#FF3300", "#990000", "#0066FF"))
最終結果

library(ggplot2)
library(ggthemes)
加載用到的包
最基本的密度圖
ggplot(data=df,aes(x=dist_cut))+
  geom_density(aes(fill=player_name))
根據運動員的名字分面
ggplot(data=df,aes(x=dist_cut))+
  geom_density(aes(fill=player_name))+
  facet_grid(player_name~.)
設置一個作圖的主題
ggplot(data=df,aes(x=dist_cut))+
  geom_density(aes(fill=player_name))+
  facet_grid(player_name~.)+
  theme_gdocs()
去掉y軸的刻度標簽
ggplot(data=df,aes(x=dist_cut))+
  geom_density(aes(fill=player_name))+
  facet_grid(player_name~.)+
  theme_gdocs()+
  theme(axis.text.y = element_blank())
更改坐標軸的標題
ggplot(data=df,aes(x=dist_cut))+
  geom_density(aes(fill=player_name))+
  facet_grid(player_name~.)+
  theme_gdocs()+
  theme(axis.text.y = element_blank())+
  labs(x="Shot Distance",y="Shot Density")
給整幅圖添加一個標題
ggplot(data=df,aes(x=dist_cut))+
  geom_density(aes(fill=player_name))+
  facet_grid(player_name~.)+
  theme_gdocs()+
  theme(axis.text.y = element_blank())+
  labs(x="Shot Distance",y="Shot Density")+
  ggtitle("Shot Distance")
自定義填充的顏色并且更改圖例的標題
ggplot(data=df,aes(x=dist_cut))+
  geom_density(aes(fill=player_name))+
  facet_grid(player_name~.)+
  theme_gdocs()+
  theme(axis.text.y = element_blank())+
  labs(x="Shot Distance",y="Shot Density")+
  ggtitle("Shot Distance")+
  scale_fill_manual("Players",
                    values = c("#FFCC33", "#FF3300", "#990000", "#0066FF"))
關于怎樣使用R語言ggplot2畫山脊圖展示NBA球員出手距離的分布就分享到這里了,希望以上內容可以對大家有一定的幫助,可以學到更多知識。如果覺得文章不錯,可以把它分享出去讓更多的人看到。
免責聲明:本站發布的內容(圖片、視頻和文字)以原創、轉載和分享為主,文章觀點不代表本網站立場,如果涉及侵權請聯系站長郵箱:is@yisu.com進行舉報,并提供相關證據,一經查實,將立刻刪除涉嫌侵權內容。