溫馨提示×
您好,登錄后才能下訂單哦!
點擊 登錄注冊 即表示同意《億速云用戶服務條款》
您好,登錄后才能下訂單哦!
本篇內容介紹了“R語言怎么實現散點圖組合頻率分布圖”的有關知識,在實際案例的操作過程中,不少人都會遇到這樣的困境,接下來就讓小編帶領大家學習一下如何處理這些情況吧!希望大家仔細閱讀,能夠學有所成!
部分數據如下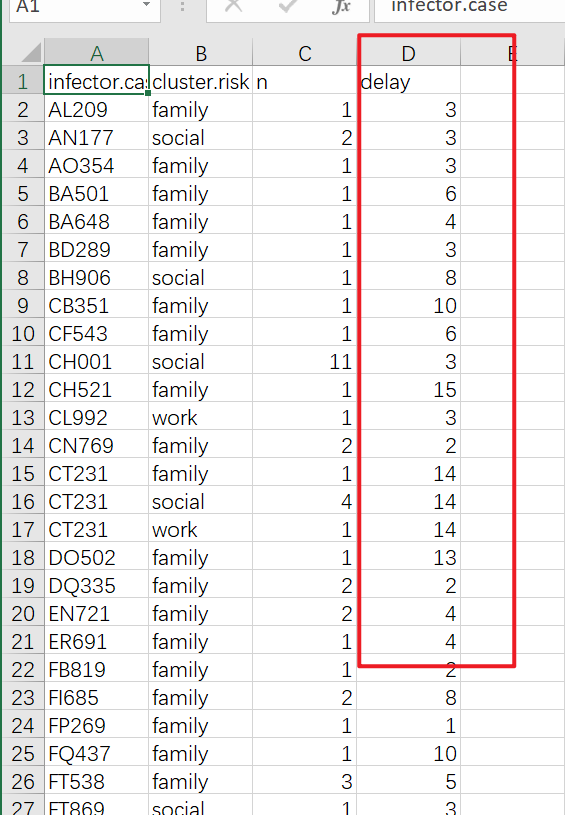
做圖用到的是最后一列數據
df1<-read.csv("example1.csv",header=T)
library(ggplot2)
ggplot(df1) +
  geom_histogram(aes(x = delay,y=..density..),
                 fill = '#dedede', colour = "black",
                 binwidth = 1) +
  scale_y_continuous("Frequency", expand = c(0,0), limits = c(0,0.20)) +
  scale_x_continuous("Delay from onset-to-isolation of infector (days)",
                     expand = c(0,0),
                     limits = c(0,27),
                     breaks = seq(0,27, by = 3)) +
  theme_classic() +
  theme(#aspect.ratio = 2,
        legend.position = 'none')
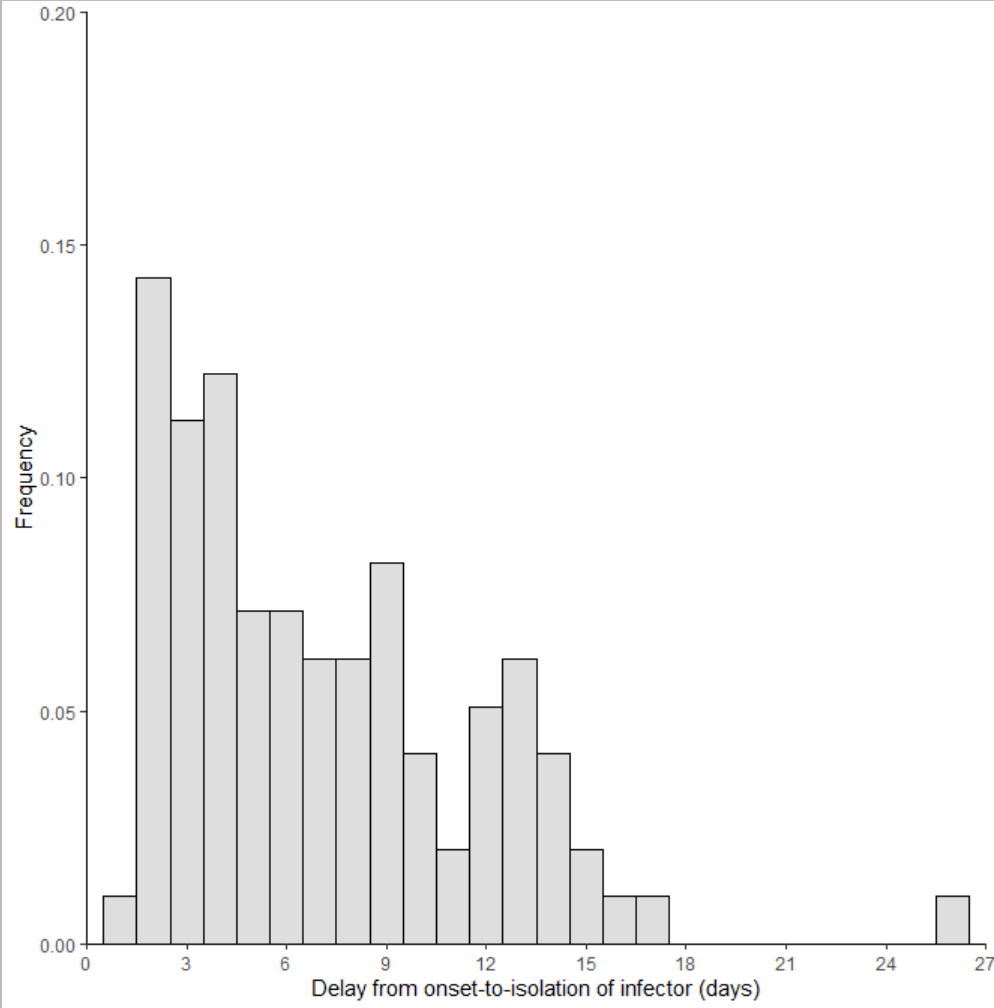
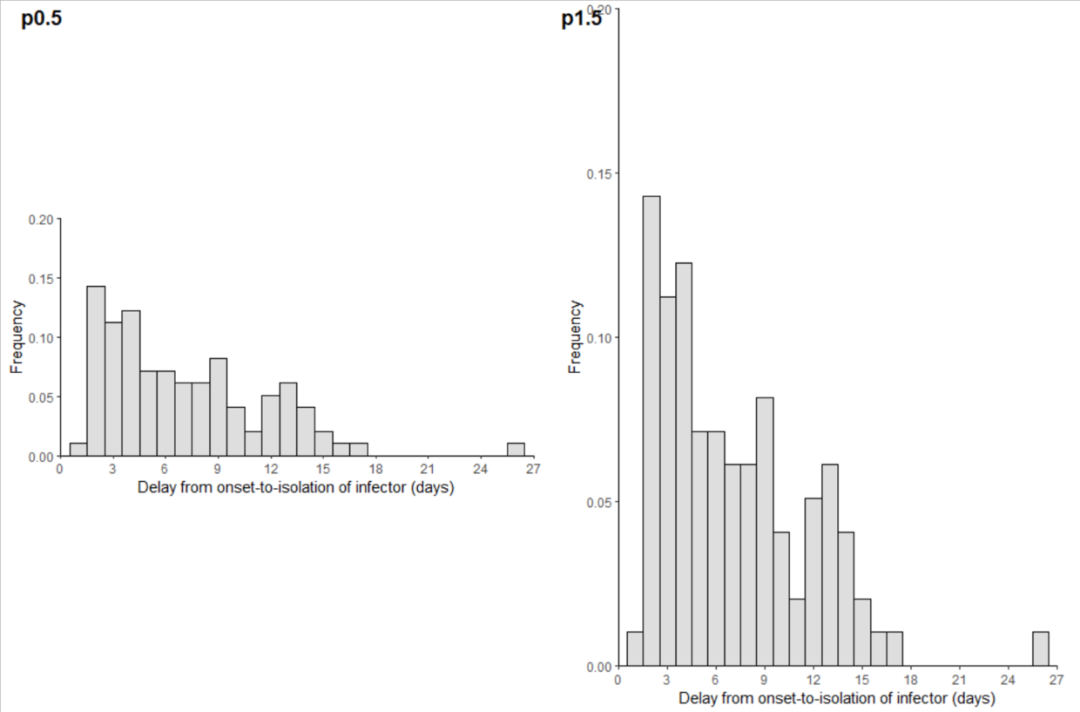
這里新學到的知識點是theme()函數里的aspect.ratio參數,這個參數可以控制整幅圖占比,如果是0到1之間就是縱向的壓縮,如果是1到2之間就是縱向的壓縮,我們分別設置0.5和1.5看下效果
p0.5<-ggplot(df1) +
  geom_histogram(aes(x = delay,y=..density..),
                 fill = '#dedede', colour = "black",
                 binwidth = 1) +
  scale_y_continuous("Frequency", expand = c(0,0), limits = c(0,0.20)) +
  scale_x_continuous("Delay from onset-to-isolation of infector (days)",
                     expand = c(0,0),
                     limits = c(0,27),
                     breaks = seq(0,27, by = 3)) +
  theme_classic() +
  theme(aspect.ratio = 0.5,
        legend.position = 'none')
p0.5
p1.5<-ggplot(df1) +
  geom_histogram(aes(x = delay,y=..density..),
                 fill = '#dedede', colour = "black",
                 binwidth = 1) +
  scale_y_continuous("Frequency", expand = c(0,0), limits = c(0,0.20)) +
  scale_x_continuous("Delay from onset-to-isolation of infector (days)",
                     expand = c(0,0),
                     limits = c(0,27),
                     breaks = seq(0,27, by = 3)) +
  theme_classic() +
  theme(aspect.ratio = 1.5,
        legend.position = 'none')
cowplot::plot_grid(p0.5,p1.5,labels = c("p0.5","p1.5"))
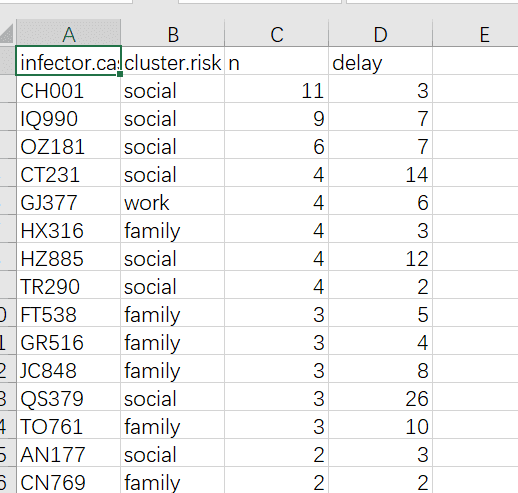
散點圖的部分數據如下
df2<-read.csv("example2.csv",header=T)
ggplot(df2) +
  geom_smooth(method = lm, aes(x=delay, y = n), color = "black", alpha = 0.1, size = 0.7) +
  geom_jitter(aes(x = delay, y = n, colour = cluster.risk), height = 0.3, width = 0.3) +
  scale_y_continuous("Secondary Cases / Infector", breaks = 1:11) +
  scale_x_continuous("Delay from onset-to-confirmation of infector (days)",
                     expand = c(0,0),
                     limits = c(0,27), breaks = seq(0,27, by = 3)) +
  theme_classic() +
  theme(aspect.ratio = 1, legend.position = c(0.85, 0.85), legend.title = element_blank())  #colours are modified custom in post
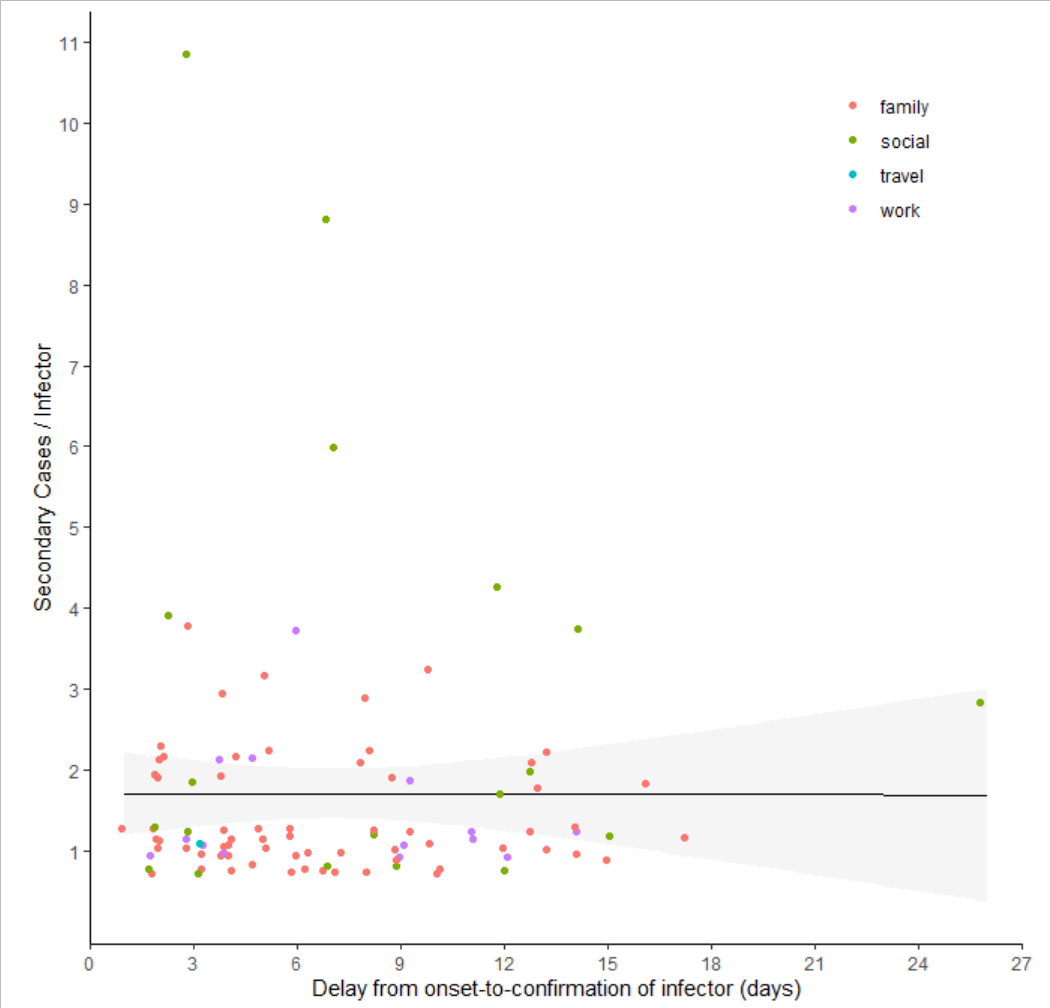
這里需要注意的是散點圖他用到的函數是geom_jitter(),而沒有用geom_point(),這兩個函數的區別是如果兩個點的坐標是一樣的geom_jitter()函數也會將兩個點分開,而geom_point()函數會將兩個點重疊的畫到一起
p1<-ggplot(df1) +
  geom_histogram(aes(x = delay,y=..density..),
                 fill = '#dedede', colour = "black",
                 binwidth = 1) +
  scale_y_continuous("Frequency", expand = c(0,0), limits = c(0,0.20)) +
  scale_x_continuous("Delay from onset-to-isolation of infector (days)",
                     expand = c(0,0),
                     limits = c(0,27),
                     breaks = seq(0,27, by = 3)) +
  theme_classic() +
  theme(#aspect.ratio = 0.5,
        legend.position = 'none')
p2<-ggplot(df2) +
  geom_smooth(method = lm, aes(x=delay, y = n), color = "black", alpha = 0.1, size = 0.7) +
  geom_jitter(aes(x = delay, y = n, colour = cluster.risk), height = 0.3, width = 0.3) +
  scale_y_continuous("Secondary Cases / Infector", breaks = 1:11) +
  scale_x_continuous("Delay from onset-to-confirmation of infector (days)",
                     expand = c(0,0),
                     limits = c(0,27), breaks = seq(0,27, by = 3)) +
  theme_classic() +
  theme( legend.position = c(0.85, 0.85),
         legend.title = element_blank())  #colours are modified custom in post
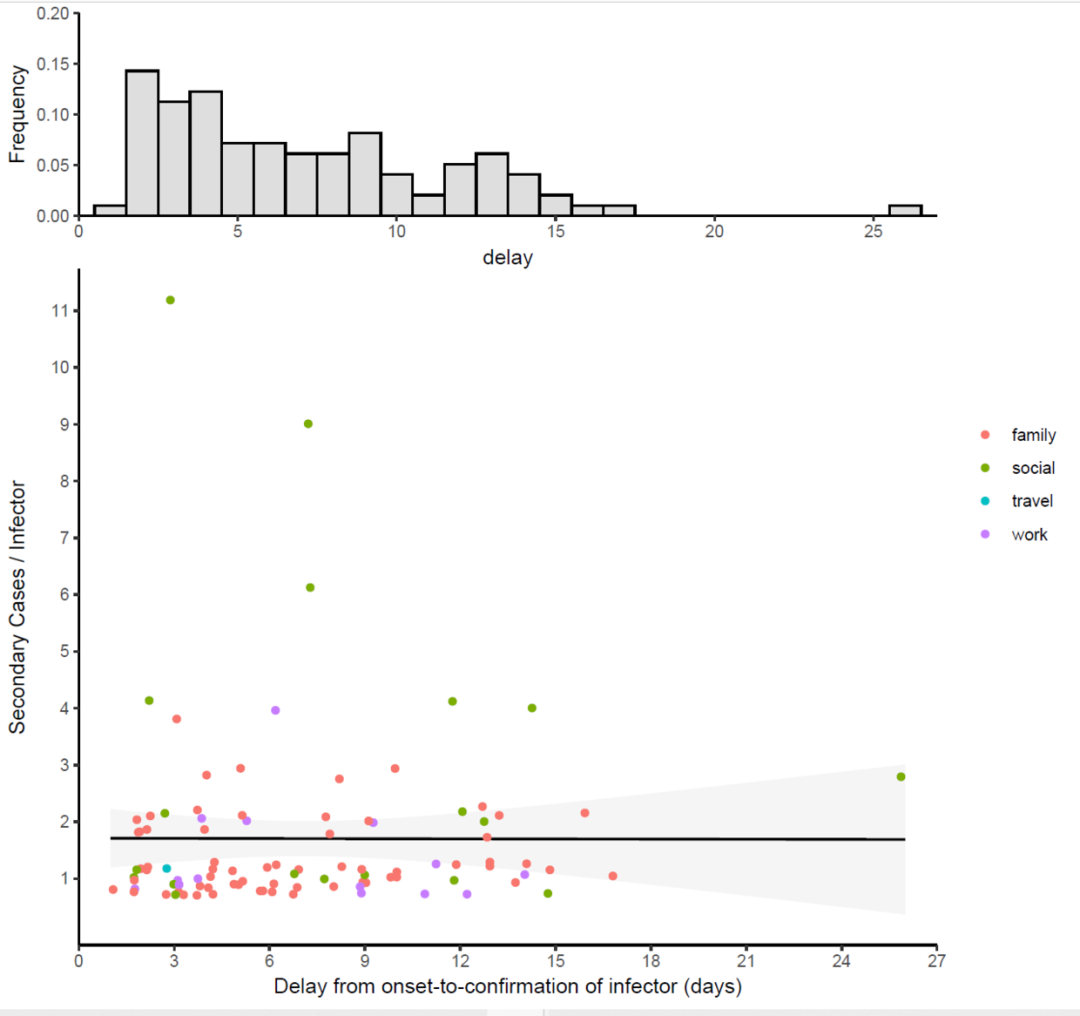
library(aplot)
p2%>%
  insert_top(p1,height = 0.3)
“R語言怎么實現散點圖組合頻率分布圖”的內容就介紹到這里了,感謝大家的閱讀。如果想了解更多行業相關的知識可以關注億速云網站,小編將為大家輸出更多高質量的實用文章!
免責聲明:本站發布的內容(圖片、視頻和文字)以原創、轉載和分享為主,文章觀點不代表本網站立場,如果涉及侵權請聯系站長郵箱:is@yisu.com進行舉報,并提供相關證據,一經查實,將立刻刪除涉嫌侵權內容。