您好,登錄后才能下訂單哦!
您好,登錄后才能下訂單哦!
小編給大家分享一下Pandas如何讓繪圖變得更美觀,希望大家閱讀完這篇文章之后都有所收獲,下面讓我們一起去探討吧!
流行 Python 數據分析庫 Pandas 中的繪圖功能一直是迅速繪制圖表的首選之一。但是,其可用的可視化效果總是十分粗略,實用有余、美觀不足。
筆者常用 Pandas 的繪圖功能快速地執行一些可視的數據探索,但在介紹數據洞察時,我會使用“更美觀”的繪圖庫(如 Plotly 或 Bokeh )來重做可視化。
自最新的 Pandas 版本0.25.3發布后,無需這樣做了,現在我們可以使用第三方可視化庫作為 Pandas 繪圖功能的后端。Plotly是一款基于 web 實現交互式可視化的流行Python庫,其最近發布了 Pandas繪圖后端。
來看看如何使用 Plotly 和 Bokeh 后端創建更豐富的可視化效果。

使用不同的后端
想要激活繪圖功能的不同后端需在導入 pandas 后,添加此行代碼:
pd.options.plotting.backend = 'plotly'
當前可用的后端有:
Plotly
Holoviews
Matplotlib
Pandas _bokeh
Hyplot
Plotly后端
Plotly是一個 Python庫,其支持豐富的交互式可視化效果。Plotly包的好處之一在于它是在庫的 Javascript 版本之上構建的,這意味著圖表會基于Web,可以顯示為 HTML 文件或嵌入到基于Python的Web應用程序中。用戶還可以將可視化內容下載為高質量的圖像文件,以便在文檔或論文中使用。
下面來瀏覽一些Plotly作為Pandas繪圖后端的快速示例。
如果還沒有安裝Plotly ,則需要使用pip intsall plotly來安裝。如果是在Jupyterlab中使用 Plotly ,則需要額外執行幾個安裝步驟來顯示可視化效果。首先,安裝IPywaidgets:
pipenv install jupyterlab " ipywidgets>=7.5" pip install jupyterlab "ipywidgets>=7.5"
然后運行以下命令以安裝Plotly擴展:
jupyter labextension install jupyterlab-plotly@4.8.1
為了說明繪圖后端的用法,使用openml.org名為“wine(葡萄酒)”的數據集。
import pandas as pd import numpy as np from sklearn.datasets import fetch_openml pd.options.plotting.backend ='plotly' X,y =fetch_openml("wine", version=1, as_frame=True, return_X_y=True) data = pd.concat([X,y], axis=1) data.head()該數據集由各類葡萄酒的多個特征和相應的標簽組成。下圖顯示了數據集的前幾行。

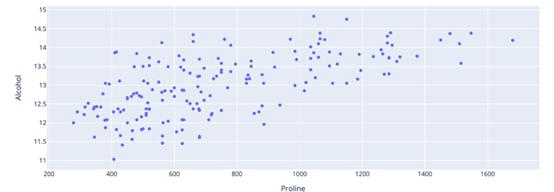
繪圖功能的工作方式與標準Pandas繪圖功能的工作方式大致相同,只是現在可視化效果同Plotly一樣豐富。下面的代碼繪制了數據集中兩個特征之間的關系。
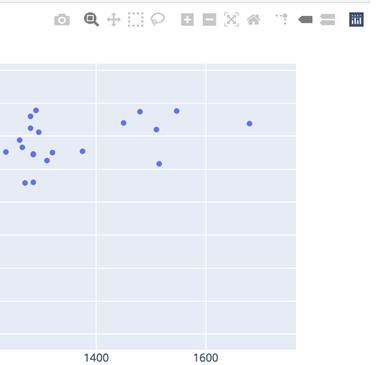
fig = data[['Alcohol', 'Proline']].plot.scatter(y='Alcohol', x='Proline') fig.show()
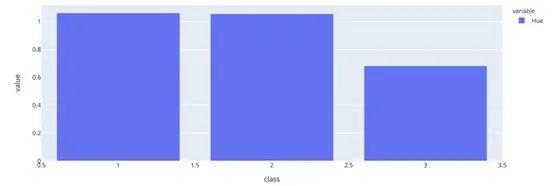
可以通過組合 Pandas 的groupby函數創建一個柱狀圖來總結類之間的平均色調差異:
data[['Hue','class']].groupby(['class']).mean().plot.bar()
將類添加到之前創建的散點圖中。使用Plotly,可以輕松地給每個類使用不同的顏色,以便直觀地區分:
fig = data[['Alcohol', 'Proline']].plot.scatter(y='Alcohol', x='Proline') fig.show()

Bokeh 后端
Bokeh 也可以提供豐富交互式可視化效果。其可視化圖表可以在 Web 瀏覽器中查看,嵌入到 Web應用程序中或用于創建交互式儀表板。Bokeh 甚至有一個流式 API,可以為流數據(如金融市場數據)創建實時可視化圖表。
庫可以通過pip來安裝:
pip install pandas-bokeh
要在 Jupyterlab中顯示 Bokeh的可視化效果,需要安裝兩個新的擴展:
jupyter labextension install @jupyter-widgets/jupyterlab-managerjupyterlabextension install @bokeh/jupyter_bokeh
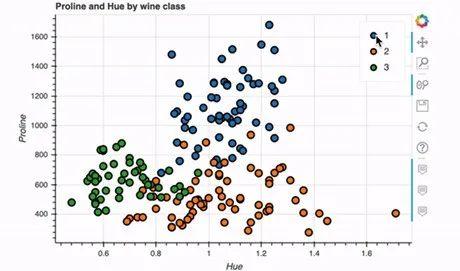
使用 Bokeh 后端重新創建之前的散點圖:
pd.options.plotting.backend ='pandas_bokeh' import pandas_bokeh from bokeh.io import output_notebook from bokeh.plotting import figure, show output_notebook() p1= data.plot_bokeh.scatter(x='Hue', y='Proline', category='class', title='Proline and Hue by wine class', show_figure=False) show(p1)
可視化效果如下:
Bokeh 有一個plot_grid函數,可為多個圖表創建儀表板式布局。下面的代碼在網格布局中創建四個圖表:
output_notebook() p1 = data.plot_bokeh.scatter(x='Hue', y='Proline', category='class', title='Proline and Hue by wine class', show_figure=False) p2 = data[['Hue','class']].groupby(['class']).mean().plot.bar(title='Mean Hue per Class') df_hue = pd.DataFrame({ 'class_1': data[data['class'] =='1']['Hue'], 'class_2': data[data['class'] =='2']['Hue'], 'class_3': data[data['class'] =='3']['Hue']}, columns=['class_1', 'class_2', 'class_3']) p3 = df_hue.plot_bokeh.hist(title='Distribution perClass: Hue') df_proline = pd.DataFrame({ 'class_1': data[data['class'] =='1']['Proline'], 'class_2': data[data['class'] =='2']['Proline'], 'class_3': data[data['class'] =='3']['Proline']}, columns=['class_1', 'class_2', 'class_3']) p4 =df_proline.plot_bokeh.hist(title='Distribution per Class: Proline') pandas_bokeh.plot_grid([[p1, p2], [p3, p4]], plot_width=450)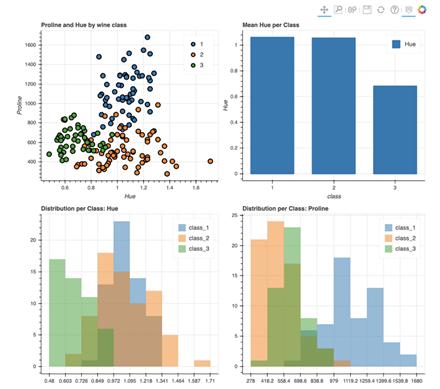
為內置的Pandas繪圖功能添加多個第三方后端,這大大增強了該庫用于數據可視化的能力。從此之后,pandas就可以集美貌與實用于一身啦。
看完了這篇文章,相信你對“Pandas如何讓繪圖變得更美觀”有了一定的了解,如果想了解更多相關知識,歡迎關注億速云行業資訊頻道,感謝各位的閱讀!
免責聲明:本站發布的內容(圖片、視頻和文字)以原創、轉載和分享為主,文章觀點不代表本網站立場,如果涉及侵權請聯系站長郵箱:is@yisu.com進行舉報,并提供相關證據,一經查實,將立刻刪除涉嫌侵權內容。