您好,登錄后才能下訂單哦!
您好,登錄后才能下訂單哦!
這期內容當中小編將會給大家帶來有關Python中怎么使用使用Plotly實現數據可視化,文章內容豐富且以專業的角度為大家分析和敘述,閱讀完這篇文章希望大家可以有所收獲。
Plotly 是一個數據繪圖庫,具有整潔的接口,它旨在允許你構建自己的 API。
Plotly 是一個繪圖生態系統,可以讓你在 Python 以及 JavaScript 和 R 中進行繪圖。在本文中,我將重點介紹使用 Python 庫進行繪圖。
Plotly 有三種不同的 Python API,你可以選擇不同的方法來使用它:
類似于 Matplotlib 的面向對象的 API
數據驅動的 API,通過構造類似 JSON 的數據結構來定義繪圖
類似于 Seaborn 的高級繪圖接口,稱為 “Plotly Express” API
我將通過使用每個 API 來繪制相同的圖來探索它們:英國大選結果的分組柱狀圖。
在我們進一步探討之前,請注意,你可能需要調整你的 Python 環境來讓這段代碼運行,包括以下內容:
運行最新版本的Python(Linux、Mac 和 Windows 的說明)
確認你運行的 Python 版本能與這些庫一起工作
數據可在線獲得,可以用 Pandas 導入。
import pandas as pddf = pd.read_csv('https://anvil.works/blog/img/plotting-in-python/uk-election-results.csv')現在我們可以繼續進行了。
Plotly 面向對象的 API 被稱為 graph_objects,它有點類似于 Matplotlib 的面向對象 API。
要創建一個柱狀圖,你可以構造一個包含四個柱狀圖的對象:
# 導入 Plotly 和數據import plotly.graph_objects as gofrom votes import wide as df # 得到 x 列表years = df['year']x = list(range(len(years))) # 定義繪圖bar_plots = [ go.Bar(x=x, y=df['conservative'], name='Conservative', marker=go.bar.Marker(color='#0343df')), go.Bar(x=x, y=df['labour'], name='Labour', marker=go.bar.Marker(color='#e50000')), go.Bar(x=x, y=df['liberal'], name='Liberal', marker=go.bar.Marker(color='#ffff14')), go.Bar(x=x, y=df['others'], name='Others', marker=go.bar.Marker(color='#929591')),] # 指定樣式layout = go.Layout( title=go.layout.Title(text="Election results", x=0.5), yaxis_title="Seats", xaxis_tickmode="array", xaxis_tickvals=list(range(27)), xaxis_ticktext=tuple(df['year'].values),) # 繪制柱狀圖fig = go.Figure(data=bar_plots, layout=layout) # 告訴 Plotly 去渲染fig.show()
與 Matplotlib 不同的是,你無需手動計算柱狀圖的 x 軸位置,Plotly 會幫你適配。
最終結果圖:
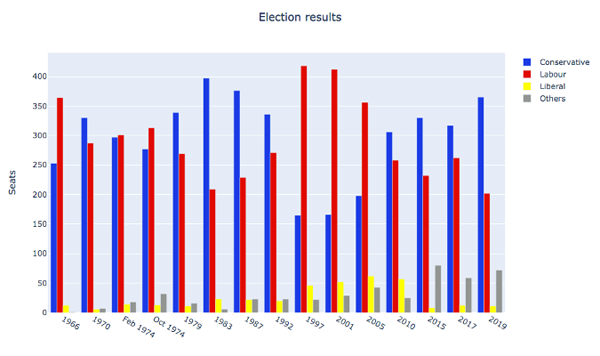
A multi-bar plot made using Graph Objects (© 2019 Anvil)
你還可以使用 Python 基本數據結構來定義繪圖,它與面對對象 API 具有相同的結構。這直接對應于 Plotly 的 JavaScript 實現的 JSON API。
# 定義繪圖數據fig = { 'data': [ {'type': 'bar', 'x': x, 'y': df['conservative'], 'name': 'Conservative', 'marker': {'color': '#0343df'}}, {'type': 'bar', 'x': x, 'y': df['labour'], 'name': 'Labour', 'marker': {'color': '#e50000'}}, {'type': 'bar', 'x': x, 'y': df['liberal'], 'name': 'Liberal', 'marker': {'color': '#ffff14'}}, {'type': 'bar', 'x': x, 'y': df['others'], 'name': 'Others', 'marker': {'color': '#929591'}}, ], 'layout': { 'title': {'text': 'Election results', 'x': 0.5}, 'yaxis': {'title': 'Seats'}, 'xaxis': { 'tickmode': 'array', 'tickvals': list(range(27)), 'ticktext': tuple(df['year'].values), } }} # 告訴 Plotly 去渲染它pio.show(fig)最終結果與上次完全相同:
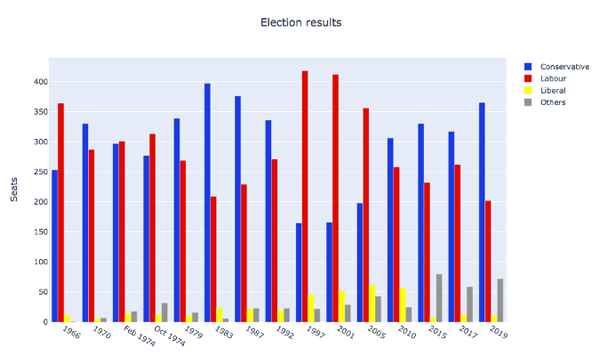
A multi-bar plot made using JSON-like data structures (© 2019 Anvil)
Plotly Express 是對圖對象進行封裝的高級 API。
你可以使用一行代碼來繪制柱狀圖:
# 導入 Plotly 和數據import plotly.express as pxfrom votes import long as df # 定義顏色字典獲得自定義欄顏色cmap = { 'Conservative': '#0343df', 'Labour': '#e50000', 'Liberal': '#ffff14', 'Others': '#929591',} # 生成圖fig = px.bar(df, x="year", y="seats", color="party", barmode="group", color_discrete_map=cmap)這里使用了長表 數據,也稱為“整潔數據”。這些列代表年份、政黨和席位,而不是按政黨劃分。這與在 Seaborn 中制作柱狀圖非常相似。
>> print(long) year party seats0 1922 Conservative 3441 1923 Conservative 2582 1924 Conservative 4123 1929 Conservative 2604 1931 Conservative 470.. ... ... ...103 2005 Others 30104 2010 Others 29105 2015 Others 80106 2017 Others 59107 2019 Others 72 [108 rows x 3 columns]
你可以訪問底層的圖對象 API 進行詳細調整。如添加標題和 y 軸標簽:
# 使用圖對象 API 來調整繪圖import plotly.graph_objects as gofig.layout = go.Layout( title=go.layout.Title(text="Election results", x=0.5), yaxis_title="Seats",)
最后,讓 Plotly 渲染:
fig.show()
這將在未使用的端口上運行一個臨時 Web 服務器,并打開默認的 Web 瀏覽器來查看圖像(Web 服務器將會馬上被關閉)。
不幸的是,結果并不完美。x 軸被視為整數,因此兩組之間的距離很遠且很小,這使得我們很難看到趨勢。
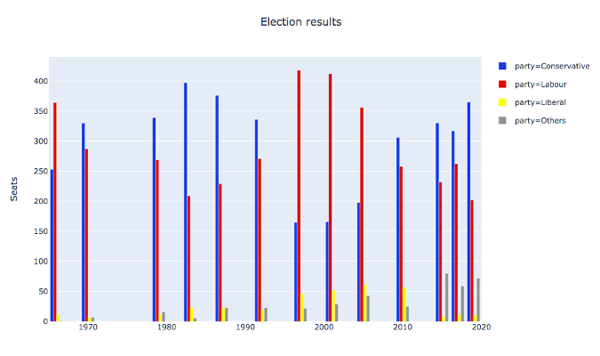
A multi-bar plot made using Plotly Express (© 2019 Anvil)
你可能會嘗試通過將 x 值轉換為字符串來使 Plotly Express 將其視為字符串,這樣它就會以均勻的間隔和詞法順序來繪制。不幸的是,它們的間隔還是很大,像在 graph_objects中那樣設置 xaxis_tickvals 也不行。
與 Seaborn 中的類似示例不同,在這種情況下,抽象似乎沒有提供足夠的應急方案來提供你想要的東西,但是也許你可以編寫自己的 API?
對 Plotly 的操作方式不滿意?那就構建自己的 Plotly API!
Plotly 的核心是一個 JavaScript 庫,它使用 D3 和 stack.gl 進行繪圖。JavaScript 庫的接口使用指定的 JSON 結構來繪圖。因此,你只需要輸出 JavaScript 庫喜歡使用的 JSON 結構就好了。
Anvil 這樣做是為了創建一個完全在瀏覽器中工作的 Python Plotly API。
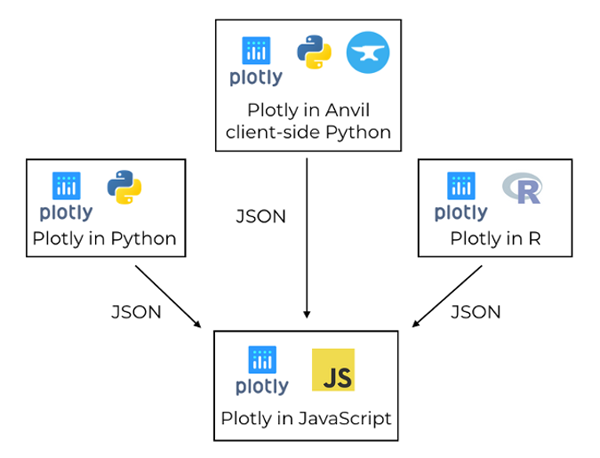
Plotly uses a JavaScript library to create plots, driven by libraries in other languages via JSON (© 2019 Anvil)
在 Anvil 版本中,你可以同時使用圖對象 API 和上面介紹的 Python 數據結構方法。運行完全相同的命令,將數據和布局分配給 Anvil 應用程序中的 Plot 組件。
這是用 Anvil 的客戶端 Python API 繪制的多列柱狀圖:
# 導入 Anvil 庫from ._anvil_designer import EntrypointTemplatefrom anvil import *import anvil.server # 導入客戶端 Plotlyimport plotly.graph_objs as go # 這是一個 Anvil 表單class Entrypoint(EntrypointTemplate): def __init__(self, **properties): # Set Form properties and Data Bindings. self.init_components(**properties) # 從服務器獲取數據 data = anvil.server.call('get_election_data') # 獲取一個方便的 x 值列表 years = data['year'] x = list(range(len(years))) # 定義繪圖 bar_plots = [ go.Bar(x=x, y=data['conservative'], name='Conservative', marker=go.Marker(color='#0343df')), go.Bar(x=x, y=data['labour'], name='Labour', marker=go.Marker(color='#e50000')), go.Bar(x=x, y=data['liberal'], name='Liberal', marker=go.Marker(color='#ffff14')), go.Bar(x=x, y=data['others'], name='Others', marker=go.Marker(color='#929591')), ] # 規定布局 layout = { 'title': 'Election results', 'yaxis': {'title': 'Seats'}, 'xaxis': { 'tickmode': 'array', 'tickvals': list(range(27)), 'ticktext': data['year'], }, } # 生成多列柱狀圖 self.plot_1.data = bar_plots self.plot_1.layout = layout繪圖邏輯與上面相同,但是它完全在 Web 瀏覽器中運行,繪圖是由用戶計算機上的 Plotly JavaScript 庫完成的!與本系列的所有其它 Python 繪圖庫相比,這是一個很大的優勢。因為其它 Python 庫都需要在服務器上運行。
這是在 Anvil 應用中運行的交互式 Plotly 圖:
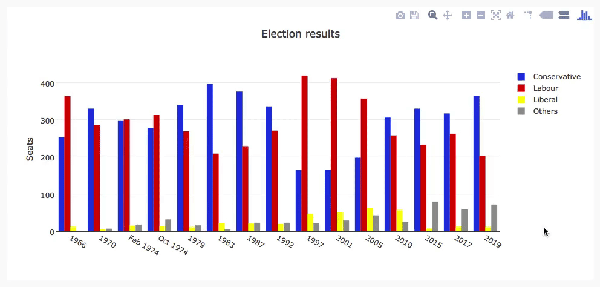
The election plot on the web using Anvil's client-side-Python Plotly library (© 2019 Anvil)
你可以復制此示例作為一個 Anvil 應用程序(注意:Anvil 需要注冊才能使用)。
在前端運行 Plotly 還有另一個優勢:它為自定義交互行為提供了更多選項。
Plotly 繪圖不僅是動態的,你可以自定義它們的互動行為。例如,你可以在每個柱狀圖中使用 hovertemplate 自定義工具提示的格式:
go.Bar( x=x, y=df['others'], name='others', marker=go.bar.Marker(color='#929591'), hovertemplate='Seats: <b>%{y}</b>', ),當你把這個應用到每個柱狀圖時,你會看到以下結果:
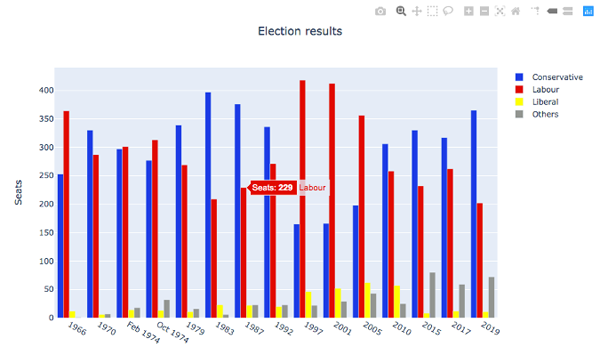
A multi-bar plot with custom tool-tips (© 2019 Anvil)
這很有用,當你想要在某些事件發生時執行任何你想要的代碼就更好了(例如,當用戶將鼠標懸停在欄上,你想要顯示一個相關選舉的信息框)。在 Anvil 的 Plotly 庫中,你可以將事件處理程序綁定到諸如懸停之類的事件,這使得復雜的交互成為可能。
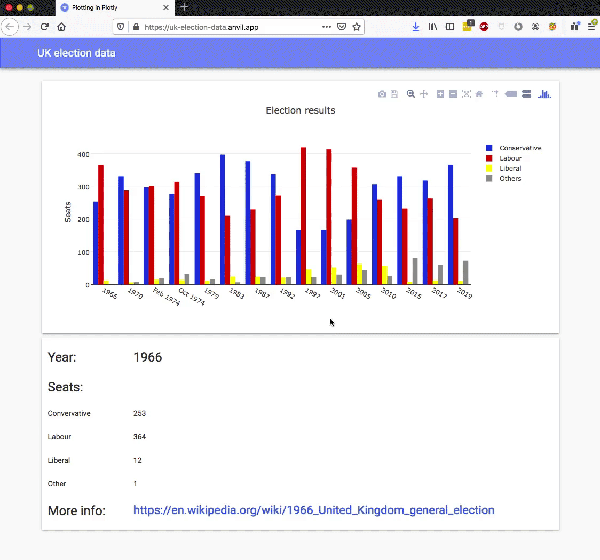
A multi-bar plot with a hover event handler (© 2019 Anvil)
你可以通過將方法綁定到繪圖的懸停事件來實現:
def plot_1_hover(self, points, **event_args): """This method is called when a data point is hovered.""" i = points[0]['point_number'] self.label_year.text = self.data['year'][i] self.label_con.text = self.data['conservative'][i] self.label_lab.text = self.data['labour'][i] self.label_lib.text = self.data['liberal'][i] self.label_oth.text = self.data['others'][i] url = f"https://en.wikipedia.org/wiki/{self.data['year'][i]}_United_Kingdom_general_election" self.link_more_info.text = url self.link_more_info.url = url上述就是小編為大家分享的Python中怎么使用使用Plotly實現數據可視化了,如果剛好有類似的疑惑,不妨參照上述分析進行理解。如果想知道更多相關知識,歡迎關注億速云行業資訊頻道。
免責聲明:本站發布的內容(圖片、視頻和文字)以原創、轉載和分享為主,文章觀點不代表本網站立場,如果涉及侵權請聯系站長郵箱:is@yisu.com進行舉報,并提供相關證據,一經查實,將立刻刪除涉嫌侵權內容。