您好,登錄后才能下訂單哦!
您好,登錄后才能下訂單哦!
本篇內容介紹了“用Python預測比特幣價格”的有關知識,在實際案例的操作過程中,不少人都會遇到這樣的困境,接下來就讓小編帶領大家學習一下如何處理這些情況吧!希望大家仔細閱讀,能夠學有所成!
在本文中,我們將討論與比特幣價格預測有關的程序。
涉及的主題:
1.什么是比特幣
2.如何使用比特幣
3.使用深度學習預測比特幣價格
比特幣是所有加密愛好者普遍使用的加密貨幣之一。即使有幾種突出的加密貨幣,如以太坊,Ripple,Litecoin等,比特幣也位居榜首。
加密貨幣通常用作我們貨幣的加密形式,廣泛用于購物,交易,投資等。
它使用對等技術,該技術背后是,沒有驅動力或任何第三方來干擾網絡內完成的交易。此外,比特幣是“開源的”,任何人都可以使用。
功能:
快速的點對點交易
全球支付
手續費低
使用的原理-密碼學:
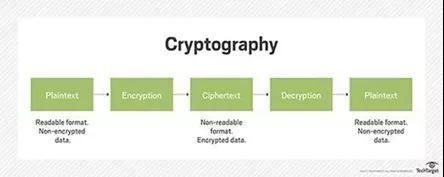
加密貨幣(比特幣)背后的工作原理是“加密”,他們使用此原理來保護和認證協商,并控制加密貨幣新組件的建立。

保護錢包:應該更安全地保護比特幣錢包,以便輕松順利地進行交易
比特幣價格易變:比特幣價格可能會波動。價格可以根據通貨膨脹率,數量等幾個因素而增加或減少。

1. 數據收集:
導入CSV文件數據集。
import pandas as pd import numpy as np import matplotlib.pyplot as plt
現在,使用pandas和numpy導入數據集。Numpy主要用于python中的科學計算,
coindata = pd.read_csv(‘Dataset.csv’) googledata = pd.read_csv(‘DS2.csv’)
已加載的原始數據集已打印,
coindata = coindata.drop([‘#’], axis=1) coindata.columns = [‘Date’,’Open’,’High’,’Low’,’Close’,’Volume’] googledata = googledata.drop([‘Date’,’#’], axis=1)
未使用的列將放在此處。
從硬幣數據和Google數據集中刪除兩列,因為它們是未使用的列。
從數據集中刪除未使用的列后,將為兩個數據集打印最終結果。
last = pd.concat([coindata,googledata], axis=1)
將兩個數據集(硬幣數據和谷歌數據)連接起來,并使用函數將其打印出來
last.to_csv(‘Bitcoin3D.csv’, index=False)
2.一維RNN:
現在將兩個數據集串聯后,將導出最終數據集。
import pandas as pd import matplotlib.pyplot as plt import numpy as np import math from sklearn.preprocessing import MinMaxScaler from sklearn.metrics import mean_squared_error from keras.models import Sequential from keras.layers import Dense, Activation, Dropout from keras.layers import LSTM
在這里使用Keras庫。Keras僅需幾行代碼即可使用有效的計算庫訓練神經網絡模型。
MinMaxScaler會通過將每個特征映射到給定范圍來轉換特征。sklearn軟件包將提供該程序所需的一些實用程序功能。
密集層將執行以下操作,并將返回輸出。
output = activation(dot(input, kernel) + bias) def new_dataset(dataset, step_size): data_X, data_Y = [], [] for i in range(len(dataset)-step_size-1): a = dataset[i:(i+step_size), 0] data_X.append(a) data_Y.append(dataset[i + step_size, 0]) return np.array(data_X), np.array(data_Y)
將在數據預處理階段收集的一維數據分解為時間序列數據,
df = pd.read_csv(“Bitcoin1D.csv”) df[‘Date’] = pd.to_datetime(df[‘Date’]) df = df.reindex(index= df.index[::-1])
數據集已加載。該功能是從Bitcoin1D.csv文件中讀取的。另外,將“日期”列轉換為“日期時間”。通過“日期”列重新索引所有數據集。
zaman = np.arange(1, len(df) + 1, 1) OHCL_avg = df.mean(axis=1)
直接分配一個新的索引數組。
OHCL_avg = np.reshape(OHCL_avg.values, (len(OHCL_avg),1)) #7288 data scaler = MinMaxScaler(feature_range=(0,1)) OHCL_avg = scaler.fit_transform(OHCL_avg)
分配定標器后規格化數據集,
#print(OHCL_avg) train_OHLC = int(len(OHCL_avg)*0.56) test_OHLC = len(OHCL_avg) — train_OHLC train_OHLC, test_OHLC = OHCL_avg[0:train_OHLC,:], OHCL_avg[train_OHLC:len(OHCL_avg),:] #Train the datasets and test it trainX, trainY = new_dataset(train_OHLC,1) testX, testY = new_dataset(test_OHLC,1)
從平均OHLC(開高低開)中創建一維維度數據集,
trainX = np.reshape(trainX, (trainX.shape[0],1,trainX.shape[1])) testX = np.reshape(testX, (testX.shape[0],1,testX.shape[1])) step_size = 1
以3D維度重塑LSTM的數據集。將step_size分配給1。
model = Sequential() model.add(LSTM(128, input_shape=(1, step_size))) model.add(Dropout(0.1)) model.add(Dense(1)) model.add(Activation(‘linear’))
創建LSTM模型,
model.compile(loss=’mean_squared_error’, optimizer=’adam’) model.fit(trainX, trainY, epochs=10, batch_size=25, verbose=2)
將紀元數定義為10,batch_size為25,
trainPredict = model.predict(trainX) testPredict = model.predict(testX) trainPredict = scaler.inverse_transform(trainPredict) trainY = scaler.inverse_transform([trainY]) testPredict = scaler.inverse_transform(testPredict) testY = scaler.inverse_transform([testY])
完成了歸一化以進行繪圖,
trainScore = math.sqrt(mean_squared_error(trainY[0], trainPredict[:,0])) testScore = math.sqrt(mean_squared_error(testY[0], testPredict[:,0]))
針對預測的測試數據集計算性能度量RMSE,
trainPredictPlot = np.empty_like(OHCL_avg) trainPredictPlot[:,:] = np.nan trainPredictPlot[step_size:len(trainPredict)+step_size,:] = trainPredict
將轉換后的train數據集用于繪圖,
testPredictPlot = np.empty_like(OHCL_avg) testPredictPlot[:,:] = np.nan testPredictPlot[len(trainPredict)+(step_size*2)+1:len(OHCL_avg)-1,:] = testPredict
將轉換后的預測測試數據集用于繪圖,
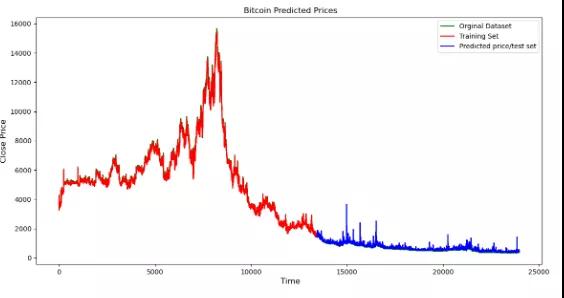
最終將預測值可視化。
OHCL_avg = scaler.inverse_transform(OHCL_avg) plt.plot(OHCL_avg, ‘g’, label=’Orginal Dataset’) plt.plot(trainPredictPlot, ‘r’, label=’Training Set’) plt.plot(testPredictPlot, ‘b’, label=’Predicted price/test set’) plt.title(“ Bitcoin Predicted Prices”) plt.xlabel(‘ Time’, fontsize=12) plt.ylabel(‘Close Price’, fontsize=12) plt.legend(loc=’upper right’) plt.show()

3.多變量的RNN:
import pandas as pd from pandas import DataFrame from pandas import concat from math import sqrt from numpy import concatenate import matplotlib.pyplot as pyplot import numpy as np from sklearn.metrics import mean_squared_error from sklearn.preprocessing import MinMaxScaler from keras import Sequential from keras.layers import LSTM, Dense, Dropout, Activation from pandas import read_csv
使用Keras庫。Keras僅需幾行代碼就可以使用有效的計算庫來訓練神經網絡模型。sklearn軟件包將提供該程序所需的一些實用程序功能。
密集層將執行以下操作,并將返回輸出。
dataset = read_csv(‘Bitcoin3D.csv’, header=0, index_col=0) print(dataset.head()) values = dataset.values
使用Pandas庫加載數據集。在這里準備了可視化的列。
groups = [0, 1, 2, 3, 5, 6,7,8,9] i = 1
將系列轉換為監督學習。
def series_to_supervised(data, n_in=1, n_out=1, dropnan=True): n_vars = 1 if type(data) is list else data.shape[1] df = DataFrame(data) cols, names = list(), list() # Here is created input columns which are (t-n, … t-1) for i in range(n_in, 0, -1): cols.append(df.shift(i)) names += [(‘var%d(t-%d)’ % (j+1, i)) for j in range(n_vars)] #Here, we had created output/forecast column which are (t, t+1, … t+n) for i in range(0, n_out): cols.append(df.shift(-i)) if i == 0: names += [(‘var%d(t)’ % (j+1)) for j in range(n_vars)] else: names += [(‘var%d(t+%d)’ % (j+1, i)) for j in range(n_vars)] agg = concat(cols, axis=1) agg.columns = names # drop rows with NaN values if dropnan: agg.dropna(inplace=True) return agg
檢查值是否為數字格式,
values = values.astype(‘float32’)
數據集值通過使用MinMax方法進行歸一化,
scaler = MinMaxScaler(feature_range=(0,1)) scaled = scaler.fit_transform(values)
將規范化的值轉換為監督學習,
reframed = series_to_supervised(scaled,1,1) #reframed.drop(reframed.columns[[9,10,11,12,13,14,15]], axis=1, inplace=True)
數據集分為兩組,分別是訓練集和測試集,
values = reframed.values train_size = int(len(values)*0.70) train = values[:train_size,:] test = values[train_size:,:]
拆分的數據集被拆分為trainX,trainY,testX和testY,
trainX, trainY = train[:,:-1], train[:,13] testX, testY = test[:,:-1], test[:,13]
訓練和測試數據集以3D尺寸重塑以用于LSTM,
trainX = trainX.reshape((trainX.shape[0],1,trainX.shape[1])) testX = testX.reshape((testX.shape[0],1,testX.shape[1]))
創建LSTM模型并調整神經元結構,
model = Sequential() model.add(LSTM(128, input_shape=(trainX.shape[1], trainX.shape[2]))) model.add(Dropout(0.05)) model.add(Dense(1)) model.add(Activation(‘linear’)) model.compile(loss=’mae’, optimizer=’adam’)
通過使用trainX和trainY訓練數據集,
history = model.fit(trainX, trainY, epochs=10, batch_size=25, validation_data=(testX, testY), verbose=2, shuffle=False)
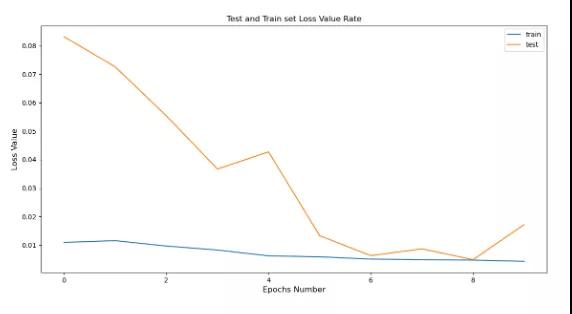
計算每個訓練時期的損耗值,并將其可視化,
pyplot.plot(history.history[‘loss’], label=’train’) pyplot.plot(history.history[‘val_loss’], label=’test’) pyplot.title(“Test and Train set Loss Value Rate”) pyplot.xlabel(‘Epochs Number’, fontsize=12) pyplot.ylabel(‘Loss Value’, fontsize=12) pyplot.legend() pyplot.show()

對訓練數據集執行預測過程,
trainPredict = model.predict(trainX) trainX = trainX.reshape((trainX.shape[0], trainX.shape[2]))
對測試數據集執行預測過程,
testPredict = model.predict(testX) testX = testX.reshape((testX.shape[0], testX.shape[2]))
訓練數據集反轉縮放比例以進行訓練,
testPredict = model.predict(testX) testX = testX.reshape((testX.shape[0], testX.shape[2]))
測試數據集反轉縮放以進行預測,
testPredict = concatenate((testPredict, testX[:, -9:]), axis=1) testPredict = scaler.inverse_transform(testPredict) testPredict = testPredict[:,0] # invert scaling for actual testY = testY.reshape((len(testY), 1)) inv_y = concatenate((testY, testX[:, -9:]), axis=1) inv_y = scaler.inverse_transform(inv_y) inv_y = inv_y[:,0]
通過將mean_squared_error用于train和測試預測來計算性能指標,
rmse2 = sqrt(mean_squared_error(trainY, trainPredict)) rmse = sqrt(mean_squared_error(inv_y, testPredict))
訓練和測試的預測集串聯在一起
final = np.append(trainPredict, testPredict) final = pd.DataFrame(data=final, columns=[‘Close’]) actual = dataset.Close actual = actual.values actual = pd.DataFrame(data=actual, columns=[‘Close’])
最后,將訓練和預測結果可視化。
pyplot.plot(actual.Close, ‘b’, label=’Original Set’) pyplot.plot(final.Close[0:16781], ‘r’ , label=’Training set’) pyplot.plot(final.Close[16781:len(final)], ‘g’, label=’Predicted/Test set’) pyplot.title(“ Bitcoin Predicted Prices”) pyplot.xlabel(‘ Time’, fontsize=12) pyplot.ylabel(‘Close Price’, fontsize=12) pyplot.legend(loc=’best’) pyplot.show()
目前為止,我們使用歷史比特幣價格數據集開發價格預測模型,通過使用Python中的RNN和LSTM算法來找到價格預測。
“用Python預測比特幣價格”的內容就介紹到這里了,感謝大家的閱讀。如果想了解更多行業相關的知識可以關注億速云網站,小編將為大家輸出更多高質量的實用文章!
免責聲明:本站發布的內容(圖片、視頻和文字)以原創、轉載和分享為主,文章觀點不代表本網站立場,如果涉及侵權請聯系站長郵箱:is@yisu.com進行舉報,并提供相關證據,一經查實,將立刻刪除涉嫌侵權內容。