您好,登錄后才能下訂單哦!
您好,登錄后才能下訂單哦!
這篇文章給大家分享的是有關pytorch如何實現手寫數字圖片識別的內容。小編覺得挺實用的,因此分享給大家做個參考,一起跟隨小編過來看看吧。
具體內容如下
數據集:MNIST數據集,代碼中會自動下載,不用自己手動下載。數據集很小,不需要GPU設備,可以很好的體會到pytorch的魅力。
模型+訓練+預測程序:
import torch
from torch import nn
from torch.nn import functional as F
from torch import optim
import torchvision
from matplotlib import pyplot as plt
from utils import plot_image, plot_curve, one_hot

# step1  load dataset
batch_size = 512
train_loader = torch.utils.data.DataLoader(
    torchvision.datasets.MNIST('mnist_data', train=True, download=True,
                               transform=torchvision.transforms.Compose([
                                   torchvision.transforms.ToTensor(),
                                   torchvision.transforms.Normalize(
                                       (0.1307,), (0.3081,)
                                   )
                               ])),
    batch_size=batch_size, shuffle=True)
test_loader = torch.utils.data.DataLoader(
    torchvision.datasets.MNIST('mnist_data/', train=False, download=True,
                               transform=torchvision.transforms.Compose([
                                   torchvision.transforms.ToTensor(),
                                   torchvision.transforms.Normalize(
                                       (0.1307,), (0.3081,)
                                   )
                               ])),
    batch_size=batch_size, shuffle=False)
x , y = next(iter(train_loader))
print(x.shape, y.shape, x.min(), x.max())
plot_image(x, y, "image_sample")

class Net(nn.Module):
    def __init__(self):
        super(Net, self).__init__()

        self.fc1 = nn.Linear(28*28, 256)
        self.fc2 = nn.Linear(256, 64)
        self.fc3 = nn.Linear(64, 10)
    def forward(self, x):
        # x: [b, 1, 28, 28]
        # h2 = relu(xw1 + b1)
        x = F.relu(self.fc1(x))
        # h3 = relu(h2w2 + b2)
        x = F.relu(self.fc2(x))
        # h4 = h3w3 + b3
        x = self.fc3(x)

        return x
net = Net()
optimizer = optim.SGD(net.parameters(), lr=0.01, momentum=0.9)

train_loss = []
for epoch in range(3):
    for batch_idx, (x, y) in enumerate(train_loader):
        #加載進來的圖片是一個四維的tensor,x: [b, 1, 28, 28], y:[512]
        #但是我們網絡的輸入要是一個一維向量(也就是二維tensor),所以要進行展平操作
        x = x.view(x.size(0), 28*28)
        #  [b, 10]
        out = net(x)
        y_onehot = one_hot(y)
        # loss = mse(out, y_onehot)
        loss = F.mse_loss(out, y_onehot)

        optimizer.zero_grad()
        loss.backward()
        # w' = w - lr*grad
        optimizer.step()

        train_loss.append(loss.item())

        if batch_idx % 10 == 0:
            print(epoch, batch_idx, loss.item())

plot_curve(train_loss)
    # we get optimal [w1, b1, w2, b2, w3, b3]


total_correct = 0
for x,y in test_loader:
    x = x.view(x.size(0), 28*28)
    out = net(x)
    # out: [b, 10]
    pred = out.argmax(dim=1)
    correct = pred.eq(y).sum().float().item()
    total_correct += correct
total_num = len(test_loader.dataset)
acc = total_correct/total_num
print("acc:", acc)

x, y = next(iter(test_loader))
out = net(x.view(x.size(0), 28*28))
pred = out.argmax(dim=1)
plot_image(x, pred, "test")
主程序中調用的函數(注意命名為utils):
import  torch
from    matplotlib import pyplot as plt


def plot_curve(data):
    fig = plt.figure()
    plt.plot(range(len(data)), data, color='blue')
    plt.legend(['value'], loc='upper right')
    plt.xlabel('step')
    plt.ylabel('value')
    plt.show()


def plot_image(img, label, name):

    fig = plt.figure()
    for i in range(6):
        plt.subplot(2, 3, i + 1)
        plt.tight_layout()
        plt.imshow(img[i][0]*0.3081+0.1307, cmap='gray', interpolation='none')
        plt.title("{}: {}".format(name, label[i].item()))
        plt.xticks([])
        plt.yticks([])
    plt.show()


def one_hot(label, depth=10):
    out = torch.zeros(label.size(0), depth)
    idx = torch.LongTensor(label).view(-1, 1)
    out.scatter_(dim=1, index=idx, value=1)
    return out
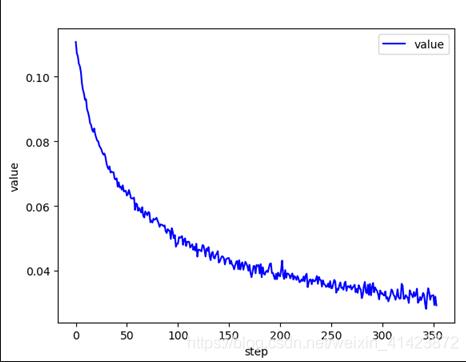
打印出損失下降的曲線圖:

訓練3個epoch之后,在測試集上的精度就可以89%左右,可見模型的準確度還是很不錯的。
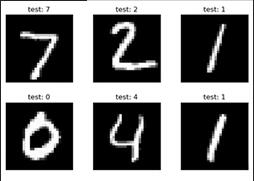
輸出六張測試集的圖片以及預測結果:

六張圖片的預測全部正確。
1.PyTorch是相當簡潔且高效快速的框架;2.設計追求最少的封裝;3.設計符合人類思維,它讓用戶盡可能地專注于實現自己的想法;4.與google的Tensorflow類似,FAIR的支持足以確保PyTorch獲得持續的開發更新;5.PyTorch作者親自維護的論壇 供用戶交流和求教問題6.入門簡單
感謝各位的閱讀!關于“pytorch如何實現手寫數字圖片識別”這篇文章就分享到這里了,希望以上內容可以對大家有一定的幫助,讓大家可以學到更多知識,如果覺得文章不錯,可以把它分享出去讓更多的人看到吧!
免責聲明:本站發布的內容(圖片、視頻和文字)以原創、轉載和分享為主,文章觀點不代表本網站立場,如果涉及侵權請聯系站長郵箱:is@yisu.com進行舉報,并提供相關證據,一經查實,將立刻刪除涉嫌侵權內容。