您好,登錄后才能下訂單哦!
您好,登錄后才能下訂單哦!
db file scattered read
一: db file scattered read 說明
二: db file scattered read 解決思路
三: db file scattered read 重現過程
四: db file scattered read 官方文檔
一: db file scattered read 說明
Oracle在執行全表掃描(
Full Table Scan,FTS)、索引快速全掃描(
Index Fast Full Scan)時,為保障性能,盡量一次性讀取多個塊,這稱為
Multi Block I/O。
每次執行Multi Block I/O,都會等待物理I/O結束,此時等待
db file scattered read事件。
https://docs.oracle.com/cd/E11882_01/server.112/e41573/instance_tune.htm#PFGRF94479
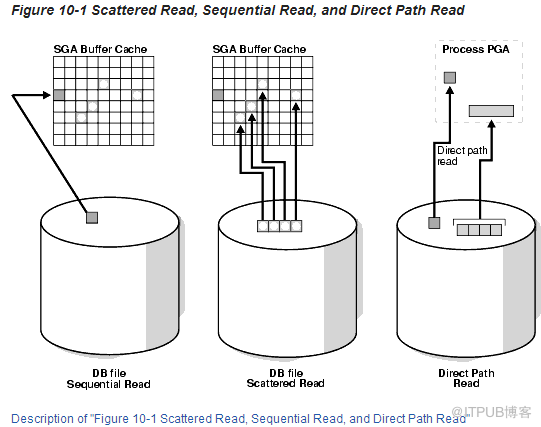
This event signifies that the user process is reading buffers into the SGA buffer cache and is waiting for a physical I/O call to return. A db file scattered read issues a scattered read to read the data into multiple discontinuous memory locations. A scattered read is usually a multiblock read. It can occur for a fast full scan (of an index) in addition to a full table scan.
The db file scattered read wait event identifies that a full scan is occurring. When performing a full scan into the buffer cache, the blocks read are read into memory locations that are not physically adjacent to each other. Such reads are called scattered read calls, because the blocks are scattered throughout memory. This is why the corresponding wait event is called 'db file scattered read'. multiblock (up to DB_FILE_MULTIBLOCK_READ_COUNT blocks) reads due to full scans into the buffer cache show up as waits for 'db file scattered read'.
https://docs.oracle.com/cd/E11882_01/server.112/e40402/waitevents003.htm#BGGIBDJI
Similar to db file sequential read, except that the session is reading multiple data blocks.
二:
db file scattered read
解決思路
1 SQL優化
如果是某些SQL引起的,例如統計信息不準確,沒有索引或使用低效的索引等,可以通過優化SQL,降低db file scattered read;
2 分區表
可以考慮將全表掃描優化成分區掃描;
3 增大BUFFER CACHE
如果db file scattered read出現特別頻繁,Buffer HIT較低,可以考慮增大buffer cache;
4 使用更快的存儲;
select name, parameter1, parameter2, parameter3
from v$event_name
where name = 'db file scattered read';

---查看含有db file scattered read等待事件的session;
SELECT sid, total_waits, time_waited
FROM v$session_event
WHERE event = 'db file scattered read'
and total_waits > 0
ORDER BY 2 desc;

select sid, event, p1, p2, p3, wait_class
from v$session_wait
where event = 'db file scattered read';

Check the following V$SESSION_WAIT parameter columns:
P1: The absolute file number
P2: The block being read
P3: The number of blocks (should be greater than 1)
select owner, segment_name, segment_type
from dba_extents
where file_id = 6
and 37475 between block_id and block_id + blocks - 1;

SELECT row_wait_obj# FROM V$SESSION WHERE EVENT = 'db file scattered read';

SELECT owner, object_name, subobject_name, object_type
FROM DBA_OBJECTS
WHERE data_object_id = '88605';

select v.last_call_et,
v.username,
v.sid,
sql.sql_text,
sql.sql_id,
sql.disk_reads,
v.event
from v$session v, v$sql sql
where v.sql_address = sql.address
and v.last_call_et > 0
and v.status = 'ACTIVE'
and v.username is not null;

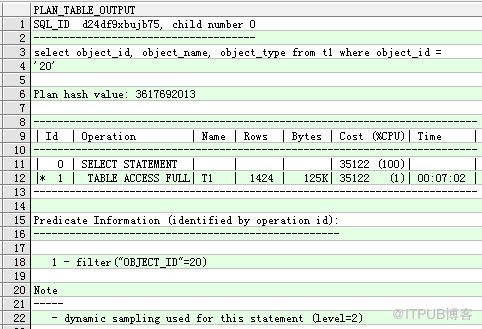
select * from table(dbms_xplan.display_cursor('d24df9xbujb75'));
---SELECT SQL_ADDRESS, SQL_HASH_VALUE
FROM V$SESSION
WHERE EVENT LIKE 'db file%read';
三: db file scattered read 重現過程
索引
快速
全掃描(Index Fast Full Scan)
SQL> create tablespace chenjch_tbs datafile '/u01/app/oracle/oradata/orcl/chenjch_tbs01a.dbf' size 10M autoextend on maxsize 1G;
SQL> create user chenjch identified by a default tablespace chenjch_tbs;
SQL> grant connect,resource,dba to chenjch;
SQL> create table t1 as select * from dba_objects;
SQL> insert into t1 select * from t1;
SQL> commit;
SQL> insert into t1 select * from t1;
SQL> commit;
SQL> insert into t1 select * from t1;
SQL> commit;
......
SQL> create index i_t1_001 on t1(object_id,object_name,object_type);
SQL>
begin
dbms_workload_repository.create_snapshot();
end;
SQL> alter system flush buffer_cache;
SQL> alter session set tracefile_identifier='10046';
SQL> alter session set events '10046 trace name context forever, level 12';
SQL> select /*+ index_ffs(t1 i_t1_001) */ object_id, object_name, object_type from t1 where object_id = '20';
SQL> alter session set events '10046 trace name context off';
SQL>
begin
dbms_workload_repository.create_snapshot();
end;
SQL>
select distinct (m.sid), p.pid, p.tracefile
from v$mystat m, v$session s, v$process p
where m.sid = s.sid
and s.paddr = p.addr;
---/u01/app/oracle/diag/rdbms/orcl/orcl/trace/orcl_ora_57032_10046.trc
[oracle@dip ~]$ tkprof /u01/app/oracle/diag/rdbms/orcl/orcl/trace/orcl_ora_57032_10046.trc /home/oracle/10046_3.trc
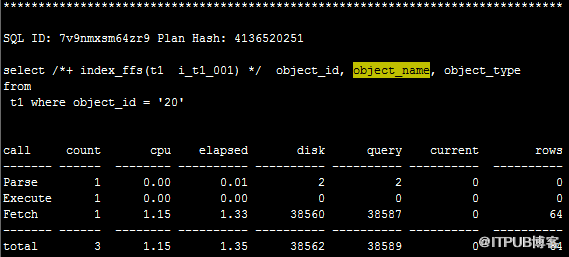


全表掃描(Full Table Scan,FTS)
http://f.dataguru.cn/thread-44033-1-1.html
Oracle 11g,在大表的全表掃描 算法上有新的變化,根據表的大小、高速緩存的大小等信息,決定是否繞過SGA直接從磁盤讀取數據。
而10g則是全部通過高速緩存讀取數據。
Oracle 11g認為大表全表時使用直接路徑讀,可能比10g中的數據文件散列讀(db file scattered reads)速度更快,效率更高,因此我們看到的大部分為
direct path read等待事件。
Oracle 11g提供我們選擇權,這個選擇權可以通過隱含參數來控制,就是"
_serial_direct_read",此參數默認值為auto
SQL> create tablespace chenjch_tbs datafile '/u01/app/oracle/oradata/orcl/chenjch_tbs01a.dbf' size 10M autoextend on maxsize 1G;
SQL> create user chenjch identified by a default tablespace chenjch_tbs;
SQL> grant connect,resource,dba to chenjch;
SQL> create table t1 as select * from dba_objects;
SQL> insert into t1 select * from t1;
SQL> commit;
SQL> insert into t1 select * from t1;
SQL> commit;
SQL> insert into t1 select * from t1;
SQL> commit;
......
SQL>
begin
dbms_workload_repository.create_snapshot();
end;
SQL> alter system flush buffer_cache;
SQL> alter session set tracefile_identifier='10046';
SQL> alter session set events '10046 trace name context forever, level 12';
SQL> select object_id, object_name, object_type from t1 where object_id = '20';
SQL> alter session set events '10046 trace name context off';
SQL>
begin
dbms_workload_repository.create_snapshot();
end;
SQL>
select distinct (m.sid), p.pid, p.tracefile
from v$mystat m, v$session s, v$process p
where m.sid = s.sid
and s.paddr = p.addr;
---/u01/app/oracle/diag/rdbms/orcl/orcl/trace/orcl_ora_55600_10046.trc
[oracle@dip ~]$ cp /u01/app/oracle/diag/rdbms/orcl/orcl/trace/orcl_ora_55600_10046.trc .
[oracle@dip ~]$ tkprof orcl_ora_55600_10046.trc 10046_1.trc
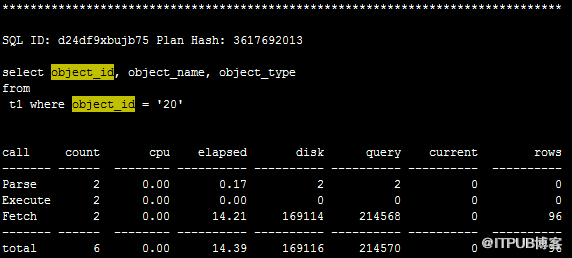


關閉 direct path read 特效,全表掃描時等待事件變成 db file scattered read
SQL>
select a.ksppinm name, b.ksppstvl value, a.ksppdesc description
from x$ksppi a, x$ksppcv b
where a.indx = b.indx
and a.ksppinm like '_serial_direct_read'; ---auto
SQL> alter session set "_serial_direct_read"=never;
SQL>
begin
dbms_workload_repository.create_snapshot();
end;
SQL> alter system flush buffer_cache;
SQL> alter session set tracefile_identifier='10046';
SQL> alter session set events '10046 trace name context forever, level 12';
SQL> select object_id, object_name, object_type from t1 where object_id = '20';
SQL> alter session set events '10046 trace name context off';
SQL>
begin
dbms_workload_repository.create_snapshot();
end;
SQL>
select distinct (m.sid), p.pid, p.tracefile
from v$mystat m, v$session s, v$process p
where m.sid = s.sid
and s.paddr = p.addr;
---/u01/app/oracle/diag/rdbms/orcl/orcl/trace/orcl_ora_55600_10046.trc
[oracle@dip ~]$ cp /u01/app/oracle/diag/rdbms/orcl/orcl/trace/orcl_ora_55600_10046.trc 10046_2.trc
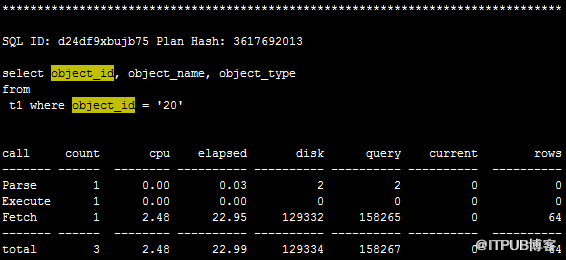
[oracle@dip ~]$ tkprof 10046_2.trc 10046_2a.trc


四: db file scattered read 官方文檔
https://docs.oracle.com/cd/E11882_01/server.112/e40402/waitevents003.htm#BGGIBDJI
Similar to db file sequential read, except that the session is reading multiple data blocks.
Wait Time: The wait time is the actual time it takes to do all of the I/Os

https://docs.oracle.com/cd/E11882_01/server.112/e41573/instance_tune.htm#PFGRF94479
This event signifies that the user process is reading buffers into the SGA buffer cache and is waiting for a physical I/O call to return. A db file scattered read issues a scattered read to read the data into multiple discontinuous memory locations. A scattered read is usually a multiblock read. It can occur for a fast full scan (of an index) in addition to a full table scan.
The db file scattered read wait event identifies that a full scan is occurring. When performing a full scan into the buffer cache, the blocks read are read into memory locations that are not physically adjacent to each other. Such reads are called scattered read calls, because the blocks are scattered throughout memory. This is why the corresponding wait event is called 'db file scattered read'. multiblock (up to DB_FILE_MULTIBLOCK_READ_COUNT blocks) reads due to full scans into the buffer cache show up as waits for 'db file scattered read'.
Check the following V$SESSION_WAIT parameter columns:
P1: The absolute file number
P2: The block being read
P3: The number of blocks (should be greater than 1)
There are several ways to handle excessive I/O waits. In the order of effectiveness, these are as follows:
Reduce the I/O activity by SQL tuning.
Reduce the need to do I/O by managing the workload.
Gather system statistics with DBMS_STATS package, allowing the query optimizer to accurately cost possible access paths that use full scans.
Use Automatic Storage Management.
Add more disks to reduce the number of I/Os for each disk.
Alleviate I/O hot spots by redistributing I/O across existing disks.
The first course of action should be to find opportunities to reduce I/O. Examine the SQL statements being run by sessions waiting for these events and statements causing high physical I/Os from V$SQLAREA. Factors that can adversely affect the execution plans causing excessive I/O include the following:
Improperly optimized SQL
Missing indexes
High degree of parallelism for the table (skewing the optimizer toward scans)
Lack of accurate statistics for the optimizer
Setting the value for DB_FILE_MULTIBLOCK_READ_COUNT initialization parameter too high which favors full scans
Besides reducing I/O, also examine the I/O distribution of files across the disks. Is I/O distributed uniformly across the disks, or are there hot spots on some disks? Are the number of disks sufficient to meet the I/O needs of the database?
See the total I/O operations (reads and writes) by the database, and compare those with the number of disks used. Remember to include the I/O activity of LGWR and ARCH processes.
Use the following query to determine, at a point in time, which sessions are waiting for I/O:
SELECT SQL_ADDRESS, SQL_HASH_VALUE
FROM V$SESSION
WHERE EVENT LIKE 'db file%read';
To determine the possible causes, first query V$SESSION to identify the value of ROW_WAIT_OBJ# when the session waits for db file scatteredread. For example:
SELECT row_wait_obj#
FROM V$SESSION
WHERE EVENT = 'db file scattered read';
To identify the object and object type contended for, query DBA_OBJECTS using the value for ROW_WAIT_OBJ# that is returned from V$SESSION. For example:
SELECT owner, object_name, subobject_name, object_type
FROM DBA_OBJECTS
WHERE data_object_id = &row_wait_obj;
https://support.oracle.com/epmos/faces/DocContentDisplay?_afrLoop=162624307195503&id=34558.1&_afrWindowMode=0&_adf.ctrl-state=1a6zu7mmvj_153
WAITEVENT: "db file scattered read" Reference Note (文檔 ID 34558.1)
|
|
|
***Checked for relevance on 05-Aug-2015*** "db file scattered read" Reference Note This is a reference note for the wait event "db file scattered read" which includes the following subsections: · Brief definition · Individual wait details (eg: For waits seen in V$SESSION_WAIT) · Systemwide wait details (eg: For waits seen in V$SYSTEM_EVENT) · Reducing waits / wait times · Troubleshooting · Known Bugs See Note:61998.1 for an introduction to Wait Events.
· Versions: 7.0 - 12.1 Documentation: 12.1 11.2 11.1 10.2 10.1 · This wait happens when a session is waiting for a multiblock IO to complete. This typically occurs during FULL TABLE SCANs or INDEX FAST FULL SCANs. Oracle reads up to DB_FILE_MULTIBLOCK_READ_COUNT consecutive blocks at a time and scatters them into buffers in the buffer cache. How this is done depends on the platform and the release of Oracle you are running. It may also vary depending on the device type being read from and the number of blocks requested.
Parameters: P1 = file# P2 = block# P3 = blocks file# This is the file# of the file that Oracle is trying to read from. In Oracle8 onwards it is the ABSOLUTE file number (AFN).
Oracle starts reading the blocks. See Note:181306.1 to determine the tablespace, filename and object for this file#,block# pair. blocks This parameter specifies the number of blocks that Oracle is trying to read from the file# starting at block#. The upper limit is DB_FILE_MULTIBLOCK_READ_COUNT, which is self tuned from Oracle 10.2 onwards. Wait Time: The wait blocks until all blocks in the IO request have been read. Note than an Oracle read request to the OS may be satisfied from an OS file system cache and so may not incur a disk IO.
IO is a normal activity so you are really interested in unnecessary or slow IO activity. If the TIME spent waiting for multiblock reads is significant then determine which segments/objects Oracle is performing the reads against. See the "Tablespace IO", and "File IO" sections of the AWR (or STATSPACK) reports, along with ADDM and ASH output. These should show which tablespaces / files are servicing the most IO requests, and give an indication of the speed of the IO subsystem. Tablespaces / files involved in "db file scattered read" waits will have "Av Blks/Rd" > 1 . The files where the reads are occuring can also be found by looking at V$FILESTAT where BLKS_READ / READS > 1 . (A ratio greater than 1 indicates there are some multiblock reads occuring). See the "Top SQL by Disk Reads" sections of AWR reports for clues about any SQL causing high I/O. If statistics gathering is enabled then V$SQL_PLAN can also give clues about SQL statements using FULL scans. It can sometimes be useful to see which sessions are performing scans and trace them to see if the scans are expected or not. This statement can be used to see which sessions are incurring waits: SELECT sid, total_waits, time_waited FROM v$session_event WHERE event='db file scattered read' and total_waits>0 ORDER BY 3,2 ; One can also look at: · Statements with high DISK_READS in V$SQL - shown in the "Top SQL by Disk Reads" section of AWR. · Sessions with high "table scans blocks gotten" in V$SESSTAT
Ideally you do not want to repeatedly perform full scans in online portions of an application when there is a faster more selective way to get at the data - in this case query tuning should be used to optimize the online SQL. In non online portions of an application table scanning is much more likely to be required. The main steps for tuning IO waits are described in Note:223117.1. Some specific points for "db file scattered read" waits include: · Tuning of SQL usually gives the largest gains · Consider partitioning to reduce the amount of data you need to scan · Are affected objects sparsely populated? If so consider shrinking them · Consider Advanced Compression to reduce the number of blocks that need to be visited · Careful use of multiple buffer pools and the CACHE option might help. Troubleshooting See the following documents for help troubleshooting issues relating to "db file scattered read" waits: Document:1475785.1 Resolving Issues Where Application Queries are Waiting Too Often for 'db file scattered read' Operations Document:1476092.1 Resolving Issues Where 'db file scattered read' Waits are Seen Due to IO Performance Problems Document:223117.1 Troubleshooting I/O Related Waits Document:1275596.1 How to Tell if the I/O of the Database is Slow Known Issues / Bugs: You can restrict the list below to issues likely to affect one of the following versions by clicking the relevant button:
· '*' indicates that an alert exists for that issue. · '+' indicates a particularly notable issue / bug. · See Note:1944526.1 for details of other symbols used
Tracing User sessions Note:62160.1 <<Parameter:DB_FILE_MULTIBLOCK_READ_COUNT>> |
歡迎關注我的微信公眾號"IT小Chen",共同學習,共同成長!!!

免責聲明:本站發布的內容(圖片、視頻和文字)以原創、轉載和分享為主,文章觀點不代表本網站立場,如果涉及侵權請聯系站長郵箱:is@yisu.com進行舉報,并提供相關證據,一經查實,將立刻刪除涉嫌侵權內容。