您好,登錄后才能下訂單哦!
您好,登錄后才能下訂單哦!
1. 插件的下載
以下是ECharts的下載鏈接,需要注意的是ECharts內部也是依賴于另一個插件的叫ZRender,當然對于大部分圖表而言不需要ZRender的,但是對于地圖控件及其他復雜的呈現控件而已都是需要ZRender的。為了避免不要的問題出現,建議大家在下載ECharts時同時也要下載ZRender。
ECharts下載地址: http://echarts.baidu.com/
ZRender下載地址:http://ecomfe.github.io/zrender/index.html
下載之后解壓各自的文件目錄結構如下:
ECharts:

ZRender:

2. 插件的引用
首先,新建一個Web應用程序,然后添加剛剛下載的文件,具體的目錄結構如下:
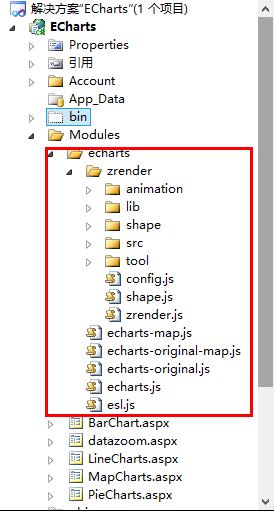
這里有以下幾點需要說明:
1) 一部分是以echarts開頭的js文件,這些文件全部來自于1.中的ECharts文件目錄中的js文件夾下的文件,也就是1.中的圖中紅框標注的js下的文件。如下:
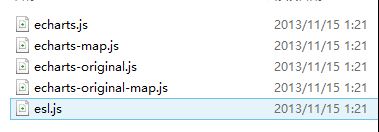
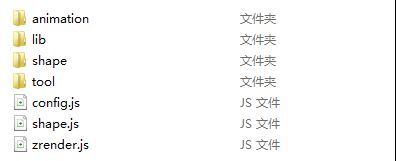
2)另一部分是一個名為zrender的文件夾,這里需要特別注意的是該文件夾的命名必須為zrender,因為在echarts的js文件中對zrender的引用都是以zrender為根目錄的,zrender文件夾的內容即為1.中zrender文件目錄中的src文件夾下的內容,如下:
3. 在頁面中的具體使用
按照上邊的步驟配置過之后,我們就可以在頁面中引用了,這里我主要是演示地圖控件的使用方式,因為地圖的引用跟其他的基本圖形的引用不太一樣。其他的圖形的呈現也會做一個簡要的演示。
MapChart
首先在跟2中的echarts文件夾同一個目錄(也就是Modules文件夾)下添加一個aspx頁或html頁,需要注意的是,如果是在aspx頁中使用echarts時,需要把要渲染的div放在form標簽之外,否則圖形是顯示不出來的。
在head標簽中添加對echarts的引用如下:
<head runat="server">
  <title></title>
  <script src="echarts/esl.js" type="text/javascript"></script>
</head>
在body標記中,form標記之外,添加一個div,用來做圖表渲染的容器。如下:
<body>

<div id="main"></div>

……………

……………

</body>
在上面中添加的div標記下,添加如下的js代碼段,如下:
 <script type="text/javascript">

    //為模塊加載器配置echarts的路徑,這里主要是配置map圖表的路徑,其他的圖表跟map的配置還不太一樣,下邊也會做另一種類型的圖表事例。
這里引用的主要是echarts文件夾下的echarts-map文件,而其他類型的圖表引用的都是echarts文件夾下的echarts文件。

    require.config({

      paths: {

        echarts:'./echarts/echarts',

        'echarts/chart/map':'./echarts/echarts-map'

      }

    });

   //動態加載echarts,在回掉函數中使用,要注意保持按需加載結構定義圖表路徑

    require(

    [

      'echarts',

      'echarts/chart/map'

    ],

    function (ec) {

      varmyChart=ecinit(documentgetElementById('main'));

      //option主要是圖標的一些設置,這不是這篇文章的重點,關于具體的設置可以參考官方的文檔說明文檔

option= {

        title: {

          text:'iphone銷量',

          subtext:'純屬虛構',

          x:'center'

        },

        tooltip: {

          trigger:'item'

        },

        legend: {

          orient:'vertical',

          x:'left',

          data: ['iphone3','iphone4','iphone5']

        },

        dataRange: {

          min:0,

          max:2500,

          text: ['高','低'],

          calculable:true,

          textStyle: {

            color:'orange'

          }

        },

        toolbox: {

          show:true,

          orient:'vertical',

          x:'right',

          y:'center',

          feature: {

            mark:true,

            dataView: { readOnly:false },

            restore:true,

            saveAsImage:true

          }

        },

        series: [

    {

      name:'iphone3',

      type:'map',

      mapType:'china',

      selectedMode: 'single',

      itemStyle: {

        normal: { label: { show:true },color:'#ffd700' },// for legend

        emphasis: { label: { show:true} }

      },

      data: [

        { name:'北京',value:Math.round(Math.random() *1000) },

        { name:'天津',value:Math.round(Math.random() *1000) },

        { name:'上海',value:Math.round(Math.random() *1000) },

        { name:'重慶',value:Math.round(Math.random() *1000) },

        { name:'河北',value:Math.round(Math.random() *1000) },

        { name:'河南',value:Math.round(Math.random() *1000) },

        { name:'云南',value:Math.round(Math.random() *1000) },

        { name:'遼寧',value:Math.round(Math.random() *1000) },

        { name:'黑龍江',value:Math.round(Math.random() *1000) },

        { name:'湖南',value:Math.round(Math.random() *1000) },

        { name:'安徽',value:Math.round(Math.random() *1000) },

        { name:'山東',value:Math.round(Math.random() *1000) },

        { name:'新疆',value:Math.round(Math.random() *1000) },

        { name:'江蘇',value:Math.round(Math.random() *1000) },

        { name:'浙江',value:Math.round(Math.random() *1000) },

        { name:'江西',value:Math.round(Math.random() *1000) },

        { name:'湖北',value:Math.round(Math.random() *1000) },

        { name:'廣西',value:Math.round(Math.random() *1000) },

        { name:'甘肅',value:Math.round(Math.random() *1000) },

        { name:'山西',value:Math.round(Math.random() *1000) },

        { name:'內蒙古',value:Math.round(Math.random() *1000) },

        { name:'陜西',value:Math.round(Math.random() *1000) },

        { name:'吉林',value:Math.round(Math.random() *1000) },

        { name:'福建',value:Math.round(Math.random() *1000) },

        { name:'貴州',value:Math.round(Math.random() *1000) },

        { name:'廣東',value:Math.round(Math.random() *1000) },

        { name:'青海',value:Math.round(Math.random() *1000) },

        { name:'西藏',value:Math.round(Math.random() *1000) },

        { name:'四川',value:Math.round(Math.random() *1000) },

        { name:'寧夏',value:Math.round(Math.random() *1000) },

        { name:'海南',value:Math.round(Math.random() *1000) },

        { name:'臺灣',value:Math.round(Math.random() *1000) },

        { name:'香港',value:Math.round(Math.random() *1000) },

        { name:'澳門',value:Math.round(Math.random() *1000) }

      ]

    },

    {

      name:'iphone4',

      type:'map',

      mapType:'china',

      selectedMode: 'single',

      itemStyle: {

        normal: { label: { show:true },color:'#ff8c00' },// for legend

        emphasis: { label: { show:true} }

      },

      data: [

        { name:'北京',value:Math.round(Math.random() *1000) },

        { name:'天津',value:Math.round(Math.random() *1000) },

        { name:'上海',value:Math.round(Math.random() *1000) },

        { name:'重慶',value:Math.round(Math.random() *1000) },

        { name:'河北',value:Math.round(Math.random() *1000) },

        { name:'安徽',value:Math.round(Math.random() *1000) },

        { name:'新疆',value:Math.round(Math.random() *1000) },

        { name:'浙江',value:Math.round(Math.random() *1000) },

        { name:'江西',value:Math.round(Math.random() *1000) },

        { name:'山西',value:Math.round(Math.random() *1000) },

        { name:'內蒙古',value:Math.round(Math.random() *1000) },

        { name:'吉林',value:Math.round(Math.random() *1000) },

        { name:'福建',value:Math.round(Math.random() *1000) },

        { name:'廣東',value:Math.round(Math.random() *1000) },

        { name:'西藏',value:Math.round(Math.random() *1000) },

        { name:'四川',value:Math.round(Math.random() *1000) },

        { name:'寧夏',value:Math.round(Math.random() *1000) },

        { name:'香港',value:Math.round(Math.random() *1000) },
        { name:'澳門',value:Math.round(Math.random() *1000) }

      ]

    },

    {

      name:'iphone5',

      type:'map',

      mapType:'china',

      selectedMode: 'single',

      itemStyle: {

        normal: { label: { show:true },color:'#da70d6' },// for legend

        emphasis: { label: { show:true} }

      },

      data: [

        { name:'北京',value:Math.round(Math.random() *1000) },

        { name:'天津',value:Math.round(Math.random() *1000) },

        { name:'上海',value:Math.round(Math.random() *1000) },

        { name:'廣東',value:Math.round(Math.random() *1000) },

        { name:'臺灣',value:Math.round(Math.random() *1000) },

        { name:'香港',value:Math.round(Math.random() *1000) },

        { name:'澳門',value:Math.round(Math.random() *1000) }

      ]

    }
  ]
      };
       //以下的這段代碼主要是用來處理用戶的選擇,應用場景是可以做地圖的交互,比如點擊地圖上的某一個省,獲取相應的省的指標變化等。
       //需要特別注意的是,如果需要點擊某一省作地圖的操作交互的話,還需要為series屬性的每一項添加一個selectedMode屬性,這里的屬性值為 'single'即單選,也可多選
  varecConfig= require('echarts/config');
      myChart.on(ecConfig.EVENT.MAP_SELECTED,function (param) {
        varselected=param.selected;
        varmapSeries=option.series[0];
        vardata= [];
        varlegendData= [];
        varname;
        for (varp=0,len=mapSeries.data.length; p<len; p++) {
          name=mapSeries.data[p].name;
          mapSeries.data[p].selected=selected[name];
          if (selected[name]) {
            alert(name); //這里只是簡單的做一個事例說明,彈出用戶所選的省,如需做其他的擴展,可以在這里邊添加相應的操作

          }
        }
      });
      myChart.setOption(option);
    }
  );
  </script>
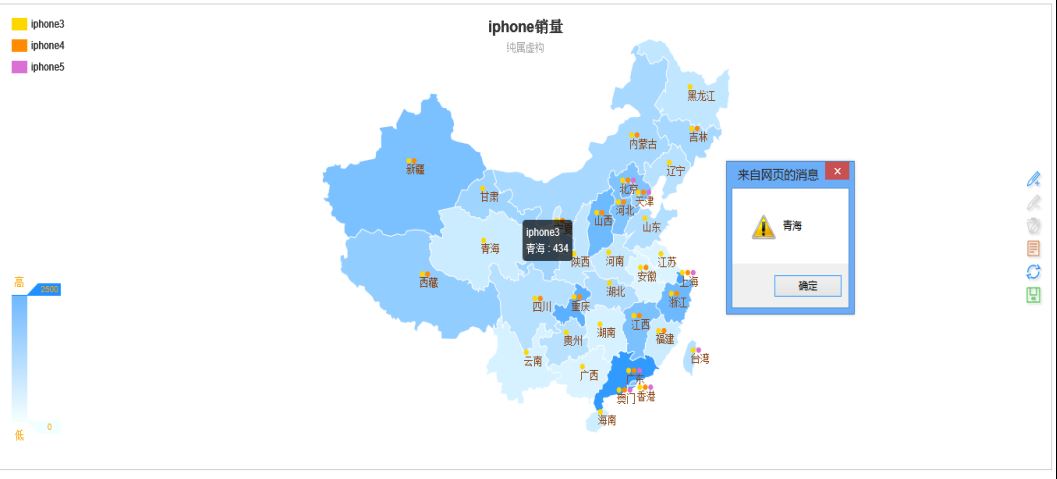
完成以上操作之后,效果如下圖所示:
LineChart
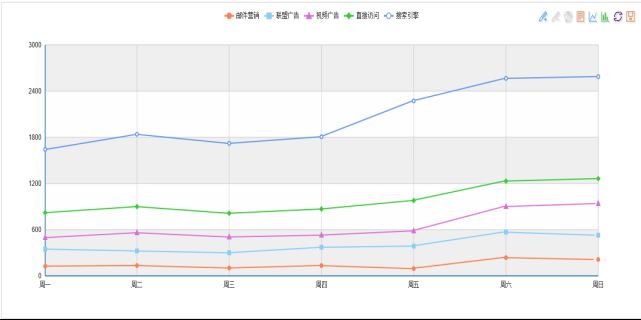
除了地圖圖表之外的其他的圖標的使用方式都差不多。事實上其他的圖表跟地圖圖表的區別在于對配置文件的引用。這里只做一個折線圖的示例,其它的示例都是一樣的。
<scripttype="text/javascript">

    require.config({

      paths: {

        echarts:'./echarts/echarts',

        'echarts/chart/bar':'./echarts/echarts',//這里需要注意的是除了mapchart使用的配置文件為echarts-map之外,
其他的圖形引用的配置文件都為echarts,這也是一般的圖形跟地圖的區別

        'echarts/chart/line':'./echarts/echarts'

      }

    });

    require(

    [

      'echarts',

      'echarts/chart/bar',

      'echarts/chart/line'

    ],

    function (ec) {

      varmyChart=ecinit(documentgetElementById('main'));

      option= {

        tooltip: {

          trigger:'axis'

        },

        legend: {

          data: ['郵件營銷','聯盟廣告','視頻廣告','直接問','搜索引擎']

        },

        toolbox: {

          show:true,

          feature: {

            mark:true,

            dataView: { readOnly:false },

            magicType: ['line','bar'],

            restore:true,

            saveAsImage:true

          }

        },

        calculable:true,

        xAxis: [

    {

      type:'category',

      boundaryGap:false,

      data: ['周一','周二','周三','周四','周五','周六','周日']

    }

  ],

        yAxis: [

    {

      type:'value',

      splitArea: { show:true }

    }

  ],

        series: [

    {

      name:'郵件營銷',

      type:'line',

      stack:'總量',

      data: [120,132,101,134,90,230,210]

    },

    {

      name:'聯盟廣告',

      type:'line',

      stack:'總量',

      data: [220,182,191,234,290,330,310]

    },

    {

      name:'視頻廣告',

      type:'line',

      stack:'總量',

      data: [150,232,201,154,190,330,410]

    },

    {

      name:'直接訪問',

      type:'line',

      stack:'總量',

      data: [320,332,301,334,390,330,320]

    },

    {

      name:'搜索引擎',

      type:'line',

      stack:'總量',

      data: [820,932,901,934,1290,1330,1320]

    }

  ]

      };


      myChart.setOption(option);

    }

  );

  </script>


  <divid="main1"></div>

  <scripttype="text/javascript">

    require.config({

      paths: {

        echarts:'./echarts/echarts',

        'echarts/chart/bar':'./echarts/echarts',

        'echarts/chart/line':'./echarts/echarts'

      }

    });

    require(

    [

      'echarts',

      'echarts/chart/bar',

      'echarts/chart/line'

    ],

    function (ec) {

      varmyChart=ecinit(documentgetElementById('main1'));

      option= {

        title: {

          text:'未來一周氣溫變化',

          subtext:'純屬虛構'

        },

        tooltip: {

          trigger:'axis'

        },

        legend: {

          data: ['最高氣溫'最低氣溫']

        },

        toolbox: {

          show:true,

          feature: {

            mark:true,

            dataView: { readOnly:false },

            magicType: ['line','bar'],

            restore:true,

            saveAsImage:true

          }

        },

        calculable:true,

        xAxis: [

    {

      type:'category',

      boundaryGap:false,

      data: ['周一','周二','周三','周四','周五','周六','周日']

    }

  ],

        yAxis: [

    {

      type:'value',

      axisLabel: {

        formatter:'{value} '

      },

      splitArea: { show:true }

    }

  ],

        series: [

    {

      name:'最高氣溫',

      type:'line',

      itemStyle: {

        normal: {

          lineStyle: {

            shadowColor:'rgba(0,0,0,4)'

          }

        }

      },

      data: [11,11,15,13,12,13,10]

    },

    {

      name:'最低氣溫',

      type:'line',

      itemStyle: {

        normal: {

          lineStyle: {

            shadowColor:'rgba(0,0,0,4)'

          }

        }

      },

      data: [-2,1,2,5,3,2,0]

    }

  ]

      };

      myChart.setOption(option);

    }

  );

  </script>


  <divid="main2"></div>

  <scripttype="text/javascript">

    require.config({

      paths: {

        echarts:'./echarts/echarts',

        'echarts/chart/bar':'./echarts/echarts',

        'echarts/chart/line':'./echarts/echarts'

      }

    });

    require(

    [

      'echarts',

      'echarts/chart/bar',

      'echarts/chart/line'

    ],

    function (ec) {

      varmyChart=ec.init(document.getElementById('main2'));

      option= {

        title: {

          text:'某樓盤銷售情況',

          subtext:'純屬虛構'

        },

        tooltip: {

          trigger:'axis'

        },

        legend: {

          data: ['意向','預購','成交']

        },

        toolbox: {

          show:true,

          feature: {

            mark:true,

            dataView: { readOnly:false },

            magicType: ['line','bar'],

            restore:true,

            saveAsImage:true

          }

        },

        calculable:true,

        xAxis: [

    {

      type:'category',

      boundaryGap:false,

      data: ['周','周二','周三','周四','周五','周六','周日']

    }

  ],

        yAxis: [

    {

      type:'value'

    }

  ],

        series: [

    {

      name:'成交',

      type:'line',

      smooth:true,

      itemStyle: { normal: { areaStyle: { type:'default'}} },

      data: [10,12,21,54,260,830,710]

    },

    {

      name:'預購',

      type:'line',

      smooth:true,

      itemStyle: { normal: { areaStyle: { type:'default'}} },

      data: [30,182,434,791,390,30,10]

    },

    {

      name:'意向',

      type:'line',

      smooth:true,

      itemStyle: { normal: { areaStyle: { type:'default'}} },

      data: [1320,1132,601,234,120,90,20]

    }

  ]

      };

      myChart.setOption(option);

    }

  );

  </script>
完成以上操作之后效果圖如下:
免責聲明:本站發布的內容(圖片、視頻和文字)以原創、轉載和分享為主,文章觀點不代表本網站立場,如果涉及侵權請聯系站長郵箱:is@yisu.com進行舉報,并提供相關證據,一經查實,將立刻刪除涉嫌侵權內容。