溫馨提示×
您好,登錄后才能下訂單哦!
點擊 登錄注冊 即表示同意《億速云用戶服務條款》
您好,登錄后才能下訂單哦!
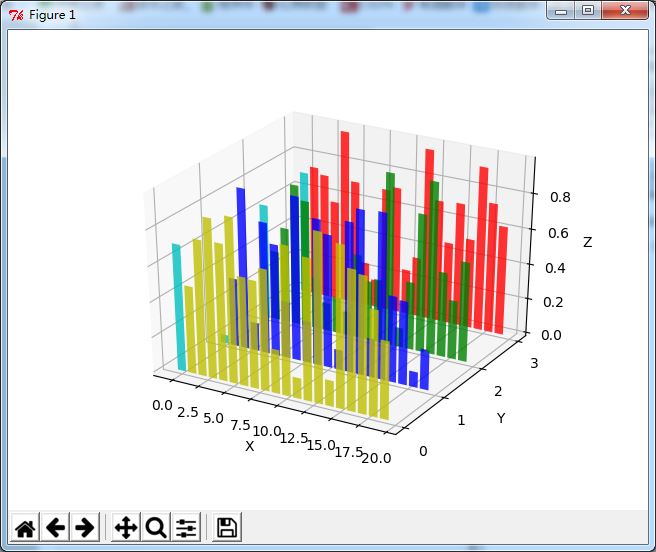
在不同平面上繪制二維條形圖。
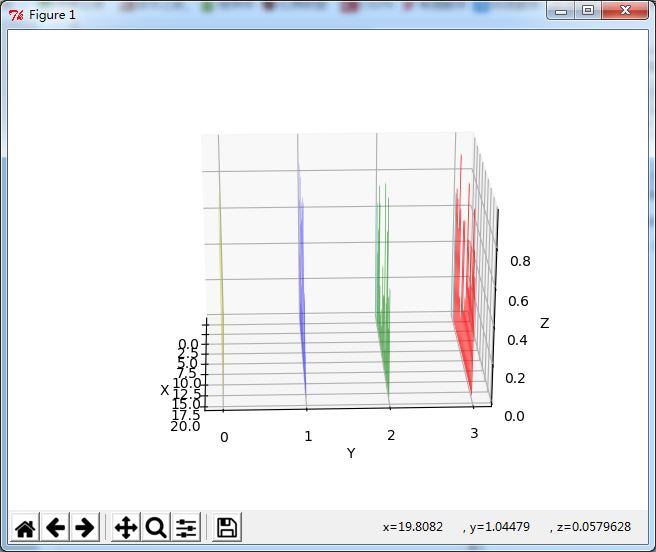
本實例制作了一個3d圖,其中有二維條形圖投射到平面y=0,y=1,等。
演示結果:


完整代碼:
from mpl_toolkits.mplot3d import Axes3D
import matplotlib.pyplot as plt
import numpy as np

# Fixing random state for reproducibility
np.random.seed(19680801)


fig = plt.figure()
ax = fig.add_subplot(111, projection='3d')

colors = ['r', 'g', 'b', 'y']
yticks = [3, 2, 1, 0]
for c, k in zip(colors, yticks):
  # Generate the random data for the y=k 'layer'.
  xs = np.arange(20)
  ys = np.random.rand(20)

  # You can provide either a single color or an array with the same length as
  # xs and ys. To demonstrate this, we color the first bar of each set cyan.
  cs = [c] * len(xs)
  cs[0] = 'c'

  # Plot the bar graph given by xs and ys on the plane y=k with 80% opacity.
  ax.bar(xs, ys, zs=k, zdir='y', color=cs, alpha=0.8)

ax.set_xlabel('X')
ax.set_ylabel('Y')
ax.set_zlabel('Z')

# On the y axis let's only label the discrete values that we have data for.
ax.set_yticks(yticks)

plt.show()
腳本運行時間:(0分0.063秒)
總結
以上就是本文關于Python+matplotlib+numpy實現在不同平面的二維條形圖的全部內容,希望對大家有所幫助。感興趣的朋友可以繼續參閱本站其他相關專題,如有不足之處,歡迎留言指出。感謝朋友們對本站的支持!
免責聲明:本站發布的內容(圖片、視頻和文字)以原創、轉載和分享為主,文章觀點不代表本網站立場,如果涉及侵權請聯系站長郵箱:is@yisu.com進行舉報,并提供相關證據,一經查實,將立刻刪除涉嫌侵權內容。