溫馨提示×
您好,登錄后才能下訂單哦!
點擊 登錄注冊 即表示同意《億速云用戶服務條款》
您好,登錄后才能下訂單哦!
這篇文章主要介紹了使用JavaScript實現DOM繪制柱狀圖效果的案例,具有一定借鑒價值,感興趣的朋友可以參考下,希望大家閱讀完這篇文章之后大有收獲,下面讓小編帶著大家一起了解一下。
具體如下:
<!DOCTYPE html>
<html>
  <head>
  <meta http-equiv="Content-Type" content="text/html; charset=utf-8" />
    <title>www.jb51.net JavaScript DOM繪制柱狀圖</title>
    <style>
      #chart-wrap{
        width:910px;
        height:240px;
        border:solid 1px #B3B3DC;
        position:relative;
        top:40px;
        left:20px;
      }
    </style>
  </head>
  <body>
    <div id="chart-wrap"></div>
    <script>
      function renderChart(data) {
        var cw = document.getElementById("chart-wrap");
        cw.innerHTML = "";
        var max = 0;
        for (var index in data) {
          if (data[index] > max)
            max = data[index];
        }
        var percent = 180 / max;
        var i = 0;
        for (var index in data) {
          var bar = document.createElement("div");
          bar.id = index + "_" + data[index];
          bar.style.height = Math.round(percent * data[index]) + "px";
          bar.style.width = "40px";
          bar.style.left = (i * 40) + 165 + "px";
          bar.style.marginLeft = (i * 20) + "px";
          bar.style.position = "absolute";
          bar.style.background = "none repeat scroll 0 0 pink";
          bar.style.overflow = "hidden";
          bar.setAttribute("title", index + ":" + data[index]);
          bar.style.display = "block";
          bar.style.top = 200 - Math.round(percent * data[index]) + "px";
          cw.appendChild(bar);
          var axis = document.createElement("div");
          axis.id = "axis_" + i;
          axis.style.width = "40px";
          axis.style.left = (i * 40) + 165 + "px";
          axis.style.marginLeft = (i * 20) + "px";
          axis.style.textAlign = "center";
          axis.style.position = "absolute";
          axis.style.top = "205px";
          axis.innerHTML = '<span > ' + i + '</span>';
          cw.appendChild(axis);
          i++;
        }
        for (var i = 0; i < 5; i++) {
          var ayis = document.createElement("div");
          ayis.style.width = "30px";
          ayis.style.position = "absolute";
          ayis.style.top = (36 * i) + (20 - 6) + "px";
          ayis.style.left = "140px";
          ayis.innerHTML = '<span > ' + Math.round(max - (max / 5) * i) + '</span>';
          cw.appendChild(ayis);
          var line = document.createElement("div");
          line.setAttribute("style", "width:580px; left:165px; border-top:1px dotted grey; height:1px; line-height:1px; display:block; overflow:hidden; position:absolute; ");
          line.style.top = (36 * i) + 20 + "px";
          cw.appendChild(line);
        }
      }
      var data = [10,60,50,30,40,80,20,70,100,90];
      renderChart(data);
    </script>
  </body>
</html>
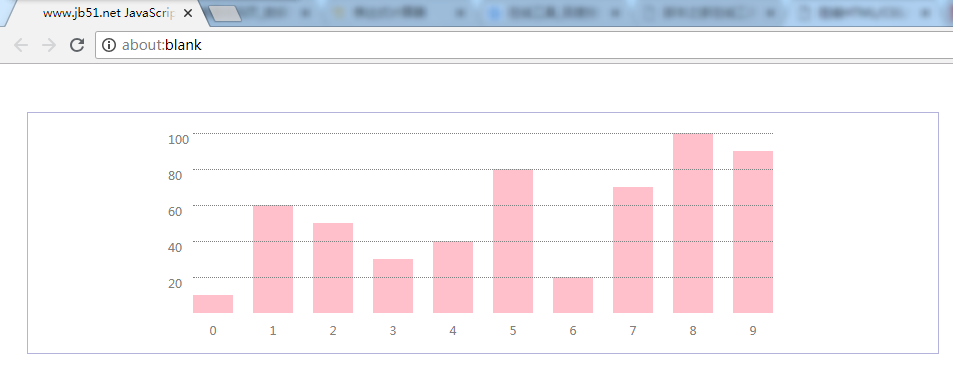
運行效果如下:

感謝你能夠認真閱讀完這篇文章,希望小編分享的“使用JavaScript實現DOM繪制柱狀圖效果的案例”這篇文章對大家有幫助,同時也希望大家多多支持億速云,關注億速云行業資訊頻道,更多相關知識等著你來學習!
免責聲明:本站發布的內容(圖片、視頻和文字)以原創、轉載和分享為主,文章觀點不代表本網站立場,如果涉及侵權請聯系站長郵箱:is@yisu.com進行舉報,并提供相關證據,一經查實,將立刻刪除涉嫌侵權內容。