溫馨提示×
您好,登錄后才能下訂單哦!
點擊 登錄注冊 即表示同意《億速云用戶服務條款》
您好,登錄后才能下訂單哦!
小編給大家分享一下如何解決echarts中多個折現數據出現坐標和值對不上的問題,希望大家閱讀完這篇文章之后都有所收獲,下面讓我們一起去探討吧!
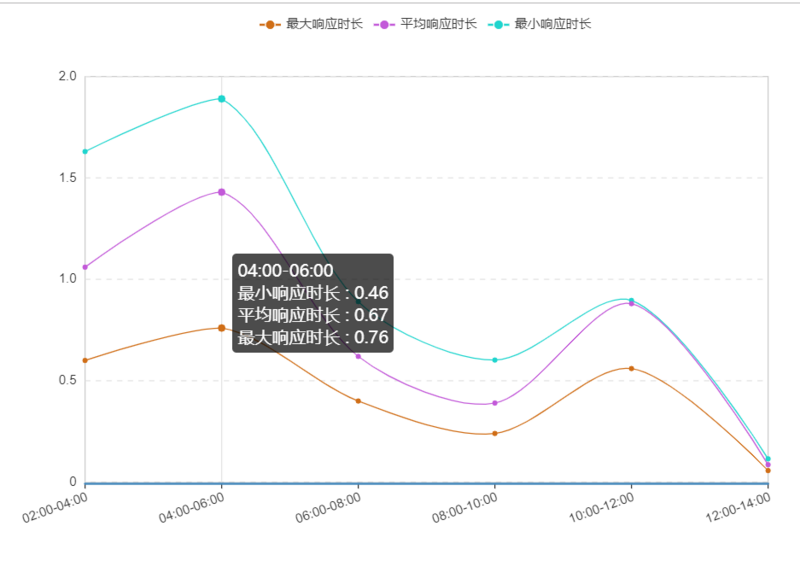
當出現多個折現數據,echarts可以配置stack值使用堆積值還是單個值

option = {
    noDataLoadingOption: {
     text: '暫無數據',
     effect: 'bubble',
     effectOption: {effect: {n: 0}}, textStyle: {fontSize: 24}
    },
    symbolList: ['circle'],
    tooltip: {
     trigger: 'axis', textStyle: {align: 'left'},
     axisPointer: {lineStyle: {color: '#E3E3E3', width: 1, type: 'solid'},}
    },
    // grid: {x: '60px', x2: '60px', borderWidth: 0},
    legend: {data: ['最大響應時長', '平均響應時長', '最小響應時長']},
    toolbox: {show: true},
    // calculable: true,
    xAxis: [{
      type: 'category',
      boundaryGap: false,
      data: ['00:00-02:00', '02:00-04:00', '04:00-06:00', '06:00-08:00', '08:00-10:00', '10:00-12:00'],
      splitLine: {lineStyle: {width: 0}},
      axisLabel: {interval: 0,/*橫軸信息全部顯示*/  rotate: 20,/*20度角傾斜顯示*/}
     }],
    yAxis: [{
      type: 'value',
      axisLine: {lineStyle: {color: '#333', width: 0, type: 'solid'}},
      splitLine: {lineStyle: {color: '#e3e3e3', width: 1, type: 'dashed'}},
     }],
    series: [
     {
      name: '最大響應時長',
      smooth: true,
      type: 'line',
      stack: '總量', // 重要的點 這個參數會使用堆積值作為縱坐標的刻量值。
      data:[........],
      itemStyle: {normal: {color: '#D06E17', lineStyle: {width: 1, color: '#D06E17'}}}
     },{
      name: '平均響應時長',
      smooth: true,
      type: 'line',
      stack: '總量', // 重要的點 這個參數會使用堆積值作為縱坐標的刻量值。
      data:[........],
      itemStyle: {normal: {color: '#C35AD9', lineStyle: {width: 1, color: '#C35AD9'}}}
     },{
      name: '最小響應時長',
      smooth: true,
      type: 'line',
      stack: '總量', // 重要的點 這個參數會使用堆積值作為縱坐標的刻量值。
      data:[........],
      itemStyle: {normal: {color: '#1FD5CE', lineStyle: {width: 1, color: '#1FD5CE'}}}
     },
   ]
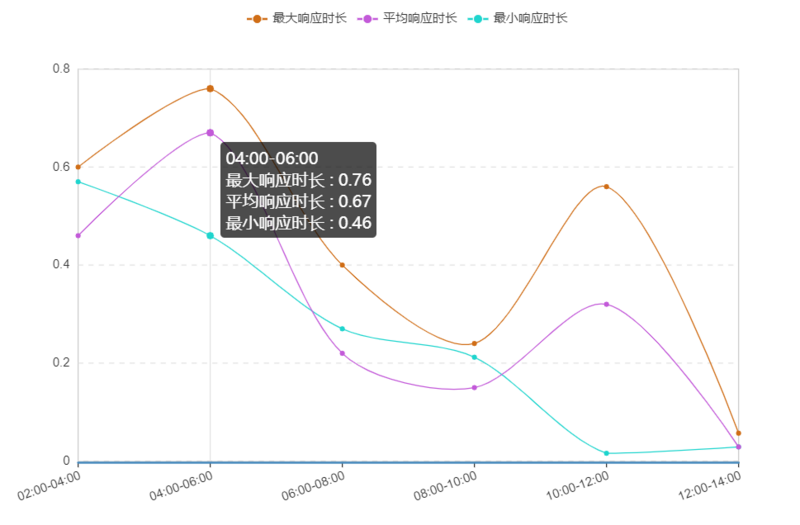
去掉stack值后

 option3 = {
    noDataLoadingOption: {
     text: '暫無數據',
     effect: 'bubble',
     effectOption: {effect: {n: 0}}, textStyle: {fontSize: 24}
    },
    symbolList: ['circle'],
    tooltip: {
     trigger: 'axis', textStyle: {align: 'left'},
     axisPointer: {lineStyle: {color: '#E3E3E3', width: 1, type: 'solid'},}
    },
    // grid: {x: '60px', x2: '60px', borderWidth: 0},
    legend: {data: ['最大響應時長', '平均響應時長', '最小響應時長']},
    toolbox: {show: true},
    // calculable: true,
    xAxis: [{
      type: 'category',
      boundaryGap: false,
      data: ['00:00-02:00', '02:00-04:00', '04:00-06:00', '06:00-08:00', '08:00-10:00', '10:00-12:00'],
      splitLine: {lineStyle: {width: 0}},
      axisLabel: {interval: 0,/*橫軸信息全部顯示*/  rotate: 20,/*20度角傾斜顯示*/}
     }],
    yAxis: [{
      type: 'value',
      axisLine: {lineStyle: {color: '#333', width: 0, type: 'solid'}},
      splitLine: {lineStyle: {color: '#e3e3e3', width: 1, type: 'dashed'}},
     }],
    series: [
     {
      name: '最大響應時長',
      smooth: true,
      type: 'line',
      // stack: '總量', // 去除stack這個參數
      itemStyle: {normal: {color: '#D06E17', lineStyle: {width: 1, color: '#D06E17'}}}
     },{
      name: '平均響應時長',
      smooth: true,
      type: 'line',
      // stack: '總量', // 去除stack這個參數
      itemStyle: {normal: {color: '#C35AD9', lineStyle: {width: 1, color: '#C35AD9'}}}
     },{
      name: '最小響應時長',
      smooth: true,
      type: 'line',
      // stack: '總量', // 去除stack這個參數
      itemStyle: {normal: {color: '#1FD5CE', lineStyle: {width: 1, color: '#1FD5CE'}}}
     },
   ]
 };
看完了這篇文章,相信你對“如何解決echarts中多個折現數據出現坐標和值對不上的問題”有了一定的了解,如果想了解更多相關知識,歡迎關注億速云行業資訊頻道,感謝各位的閱讀!
免責聲明:本站發布的內容(圖片、視頻和文字)以原創、轉載和分享為主,文章觀點不代表本網站立場,如果涉及侵權請聯系站長郵箱:is@yisu.com進行舉報,并提供相關證據,一經查實,將立刻刪除涉嫌侵權內容。