您好,登錄后才能下訂單哦!
您好,登錄后才能下訂單哦!
這篇文章給大家分享的是有關python如何通過文本在一個圖中畫多條線的內容。小編覺得挺實用的,因此分享給大家做個參考,一起跟隨小編過來看看吧。
代碼
import matplotlib.pyplot as plt
import numpy as np

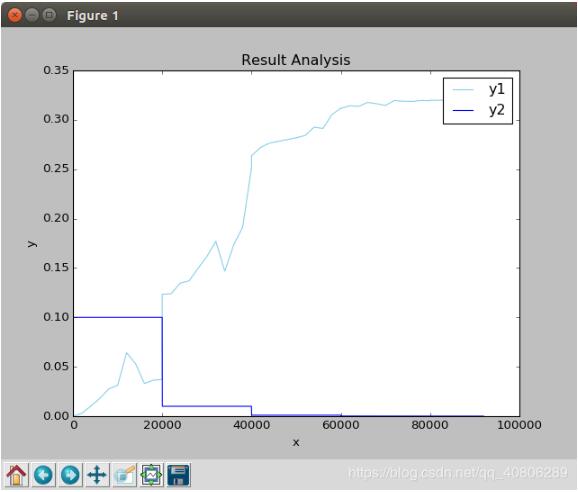
data1 = np.loadtxt('/data_1/SSD/caffe/tools/extra/DSOD300_VOC0712_DSOD300_300x300.log.test')
data2 = np.loadtxt('/data_1/SSD/caffe/tools/extra/DSOD300_VOC0712_DSOD300_300x300.log.train')

plt.title('Result Analysis')

plt.plot(data1[:,0], data1[:,2], color='skyblue', label='y1')
plt.plot(data2[:,0], data2[:,3], color='blue', label='y2')
plt.legend()

plt.xlabel('x')
plt.ylabel('y')
plt.show()
結果:
加一些不同形式的線
import matplotlib.pyplot as plt
import numpy as np

data1 = np.loadtxt('/data_1/project_test/teest1.txt')
data2 = np.loadtxt('/data_1/project_test/teest2.txt')
data3 = np.loadtxt('/data_1/project_test/teest3.txt')

plt.title('Result Analysis')

plt.plot(data1[:,0], data1[:,1], color='skyblue', label='y1',ls='-.')#ls或linestyle
plt.plot(data2[:,0], data2[:,1], color='green', label='y2',ls=':')
plt.plot(data3[:,0], data3[:,1], color='red', label='y3',ls='steps')
plt.legend()

plt.xlabel('x')
plt.ylabel('y')
plt.show()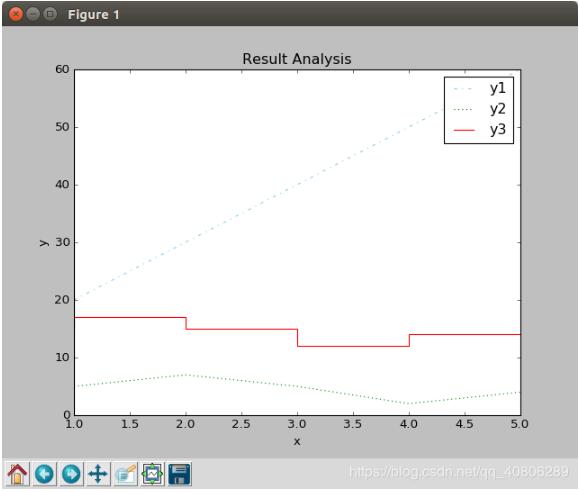
加標記
import matplotlib.pyplot as plt
import numpy as np

data1 = np.loadtxt('/data_1/project_test/teest1.txt')
data2 = np.loadtxt('/data_1/project_test/teest2.txt')
data3 = np.loadtxt('/data_1/project_test/teest3.txt')

plt.title('Result Analysis')

plt.plot(data1[:,0], data1[:,1], color='skyblue', label='y1',ls='-.',marker='*')
plt.plot(data2[:,0], data2[:,1], color='green', label='y2',ls=':',marker='+')
plt.plot(data3[:,0], data3[:,1], color='red', label='y3',ls='steps',marker='D')
plt.legend()

plt.xlabel('x')
plt.ylabel('y')
plt.show()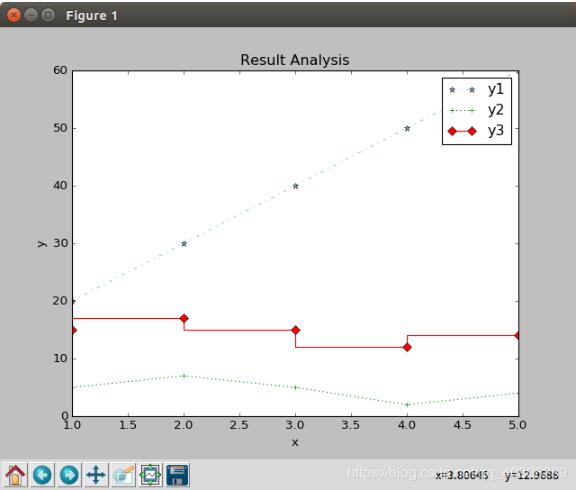
總結:
linestyle or ls:實線'-' , 破折線'--' , 點劃線'-.' ,虛線':'
plt.plot()參數設置
Property Value Type
alpha 控制透明度,0為完全透明,1為不透明
animated [True False]
antialiased or aa [True False]
clip_box a matplotlib.transform.Bbox instance
clip_on [True False]
clip_path a Path instance and a Transform instance, a Patch
color or c 顏色設置
contains the hit testing function
dash_capstyle [‘butt' ‘round' ‘projecting']
dash_joinstyle [‘miter' ‘round' ‘bevel']
dashes sequence of on/off ink in points
data 數據(np.array xdata, np.array ydata)
figure 畫板對象a matplotlib.figure.Figure instance
label 圖示
linestyle or ls 線型風格[‘-' ‘–' ‘-.' ‘:' ‘steps' …]
linewidth or lw 寬度float value in points
lod [True False]
marker 數據點的設置[‘+' ‘,' ‘.' ‘1' ‘2' ‘3' ‘4']
markeredgecolor or mec any matplotlib color
markeredgewidth or mew float value in points
markerfacecolor or mfc any matplotlib color
markersize or ms float
markevery [ None integer (startind, stride) ]
picker used in interactive line selection
pickradius the line pick selection radius
solid_capstyle [‘butt' ‘round' ‘projecting']
solid_joinstyle [‘miter' ‘round' ‘bevel']
transform a matplotlib.transforms.Transform instance
visible [True False]
xdata np.array
ydata np.array
zorder any number
補充拓展:python 畫直線和平面實例
畫直線
from mpl_toolkits.axisartist.axislines import SubplotZero
import matplotlib.pyplot as plt
import numpy as np

fig = plt.figure(1)
ax = SubplotZero(fig, 111)
fig.add_subplot(ax)

for direction in ["xzero", "yzero"]:
  # adds arrows at the ends of each axis
  ax.axis[direction].set_axisline_style("-|>")

  # adds X and Y-axis from the origin
  ax.axis[direction].set_visible(True)

for direction in ["left", "right", "bottom", "top"]:
  # hides borders
  ax.axis[direction].set_visible(False)

plt.text(-2, 2, r"y=kx+b",
     horizontalalignment='center', fontsize=20)

x = np.linspace(-2,2,100)

k=-1
b=0

y = k*x + b

ax.plot(x, y)
plt.show()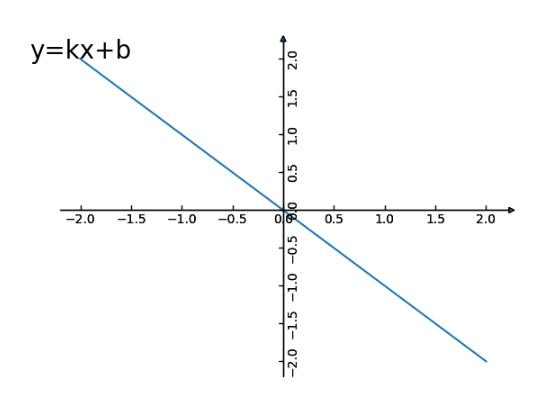
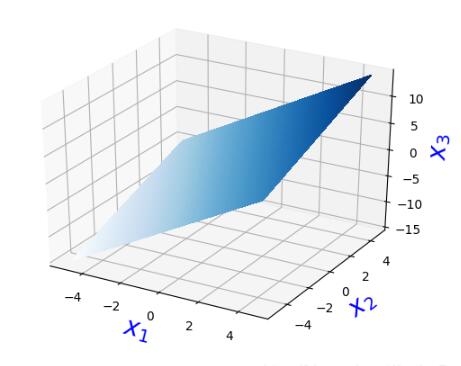
畫平面
import matplotlib.pyplot as plt
from matplotlib import cm
import numpy as np

fig = plt.figure()
ax = fig.gca(projection='3d')

# Make data.
X = np.arange(-5, 5, 0.25)
Y = np.arange(-5, 5, 0.25)
X, Y = np.meshgrid(X, Y)
a1 = 2
a2 = 1
Z = a1*X+a2*Y

# Plot the surface.
surf = ax.plot_surface(X, Y, Z, cmap=cm.Blues,
            linewidth=0, antialiased=False)

ax.set_xlabel(r'$x_1$',fontsize = 20, color = 'blue')
ax.set_ylabel(r'$x_2$',fontsize = 20, color = 'blue')
ax.set_zlabel(r'$x_3$',fontsize = 20, color = 'blue')
感謝各位的閱讀!關于“python如何通過文本在一個圖中畫多條線”這篇文章就分享到這里了,希望以上內容可以對大家有一定的幫助,讓大家可以學到更多知識,如果覺得文章不錯,可以把它分享出去讓更多的人看到吧!
免責聲明:本站發布的內容(圖片、視頻和文字)以原創、轉載和分享為主,文章觀點不代表本網站立場,如果涉及侵權請聯系站長郵箱:is@yisu.com進行舉報,并提供相關證據,一經查實,將立刻刪除涉嫌侵權內容。